Exploring the SD‑WAN Monitor tab
The Monitor tab shows the summary and granular information of for your devices, along with their network health and service information:
- organizations connecting to different core elements such as the controllers and different device types for your organization
- map displaying the different core elements and devices’ location, click on a device on the map to view the device details
- firmware summary of the associated devices
- multiple device health summary with deeper details to view a list of devices with their status
- alarm summary and drill‑down functionality to view the list of devices with their respective events
- application use of all the associated devices
- subscribed services view for each customer organization
- policy violations view for each customer organization
Network overview
The Summary subtab has seven tiles to show you activity for your network (devices and organizations):
- Tenant Summary tile
- Map View tile
- Tenant Health tile
- Recent Events tile
- System Summary tile
- Application Activity tile
- Services tile
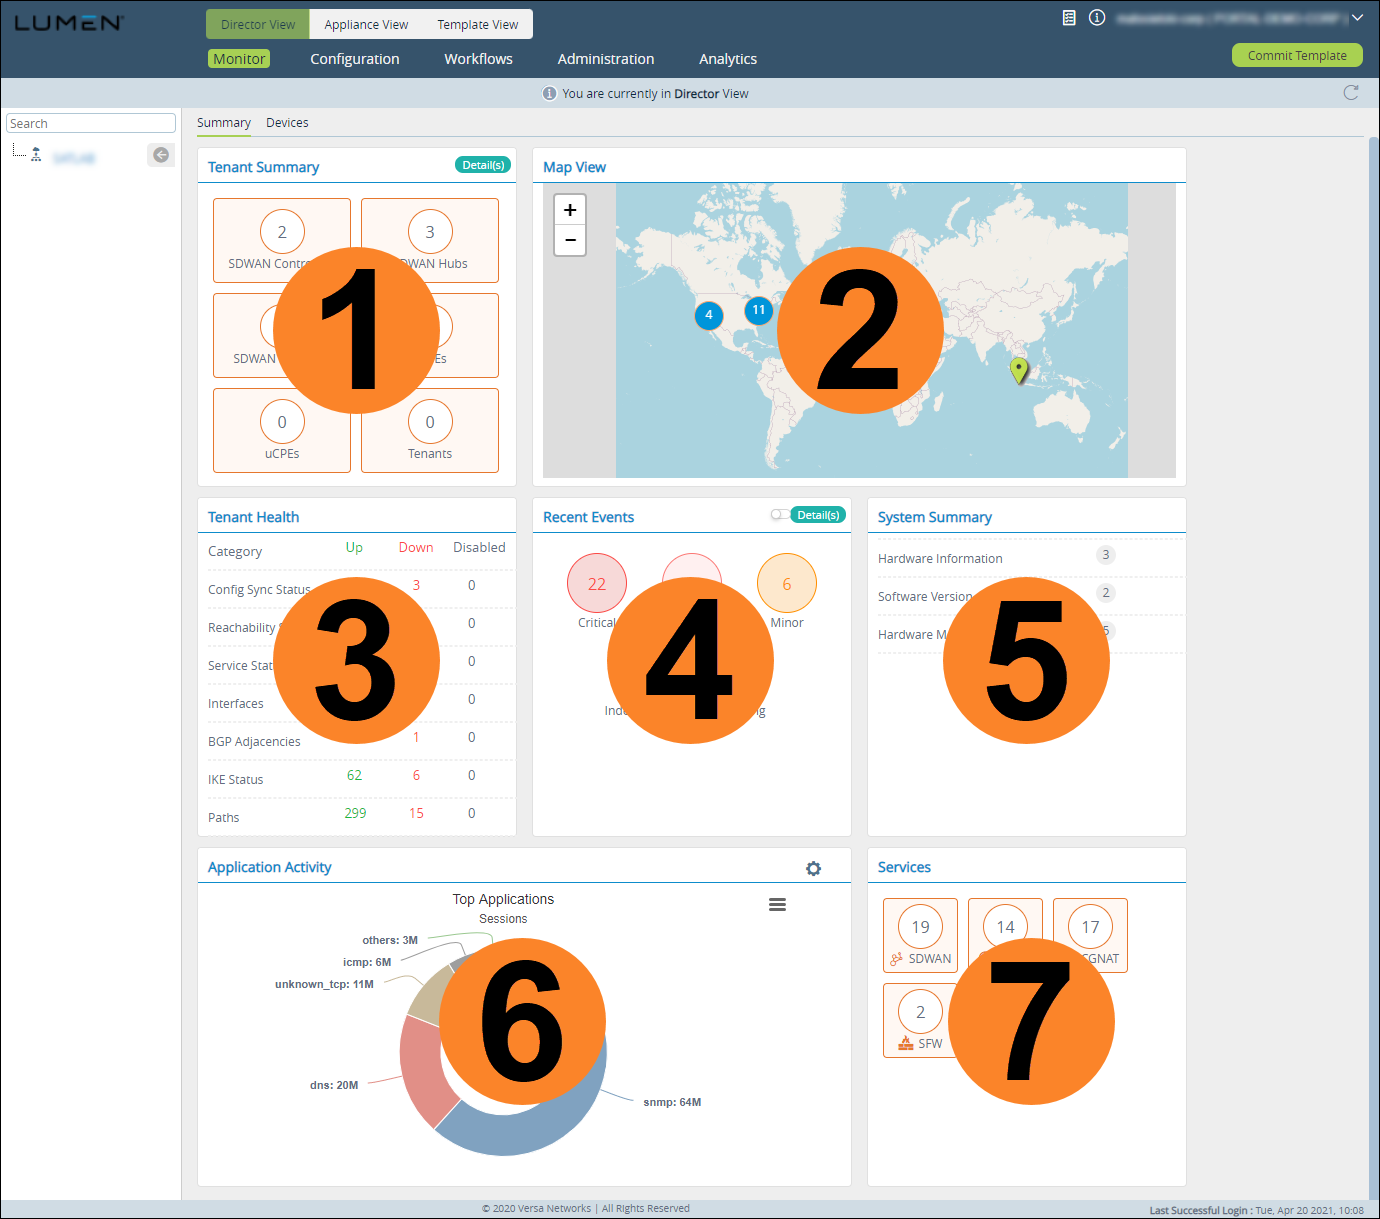
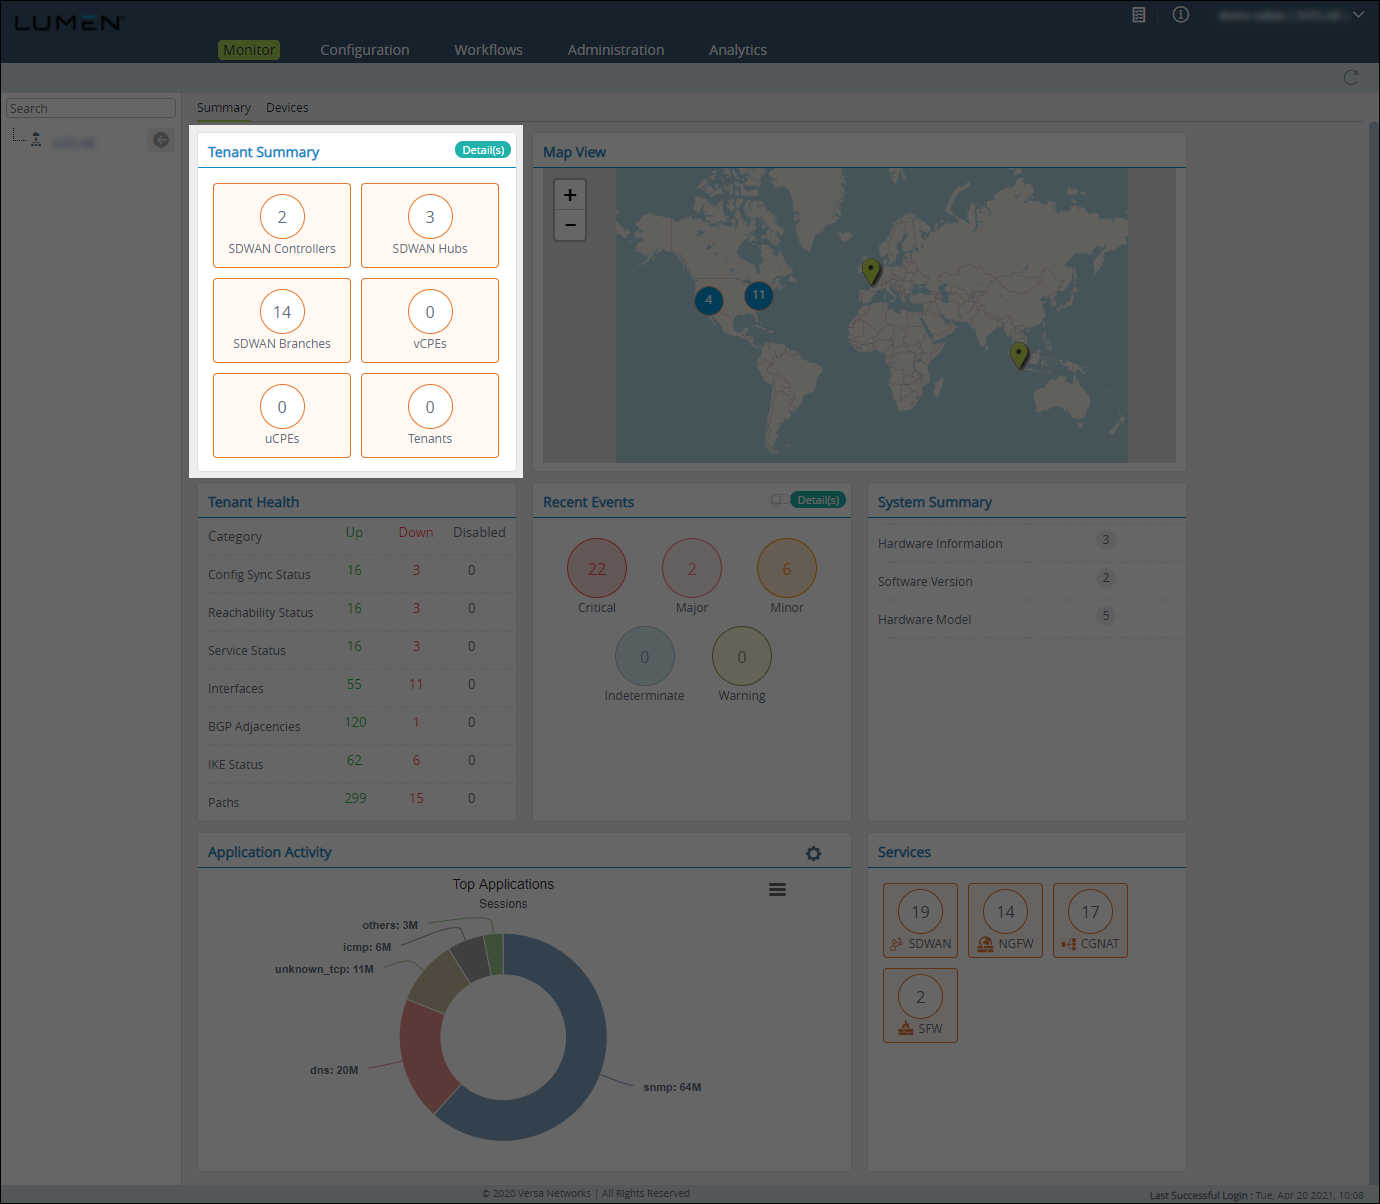
The Tenant Summary tile shows the number of core elements associated and devices for your organization:
- controllers
- hubs
- branches
- non SD-WAN nodes such as routers, DHCP, NAT, and security standalone devices
To view the tenant information as a table, click Detail on the Tenant Summary tile. (To return to tile view, click Back.)
The Map View tile shows the location of your organization's controllers, branches, and hubs:
- controllers are shown in blue
- branches are shown in green
- hubs are shown in orange
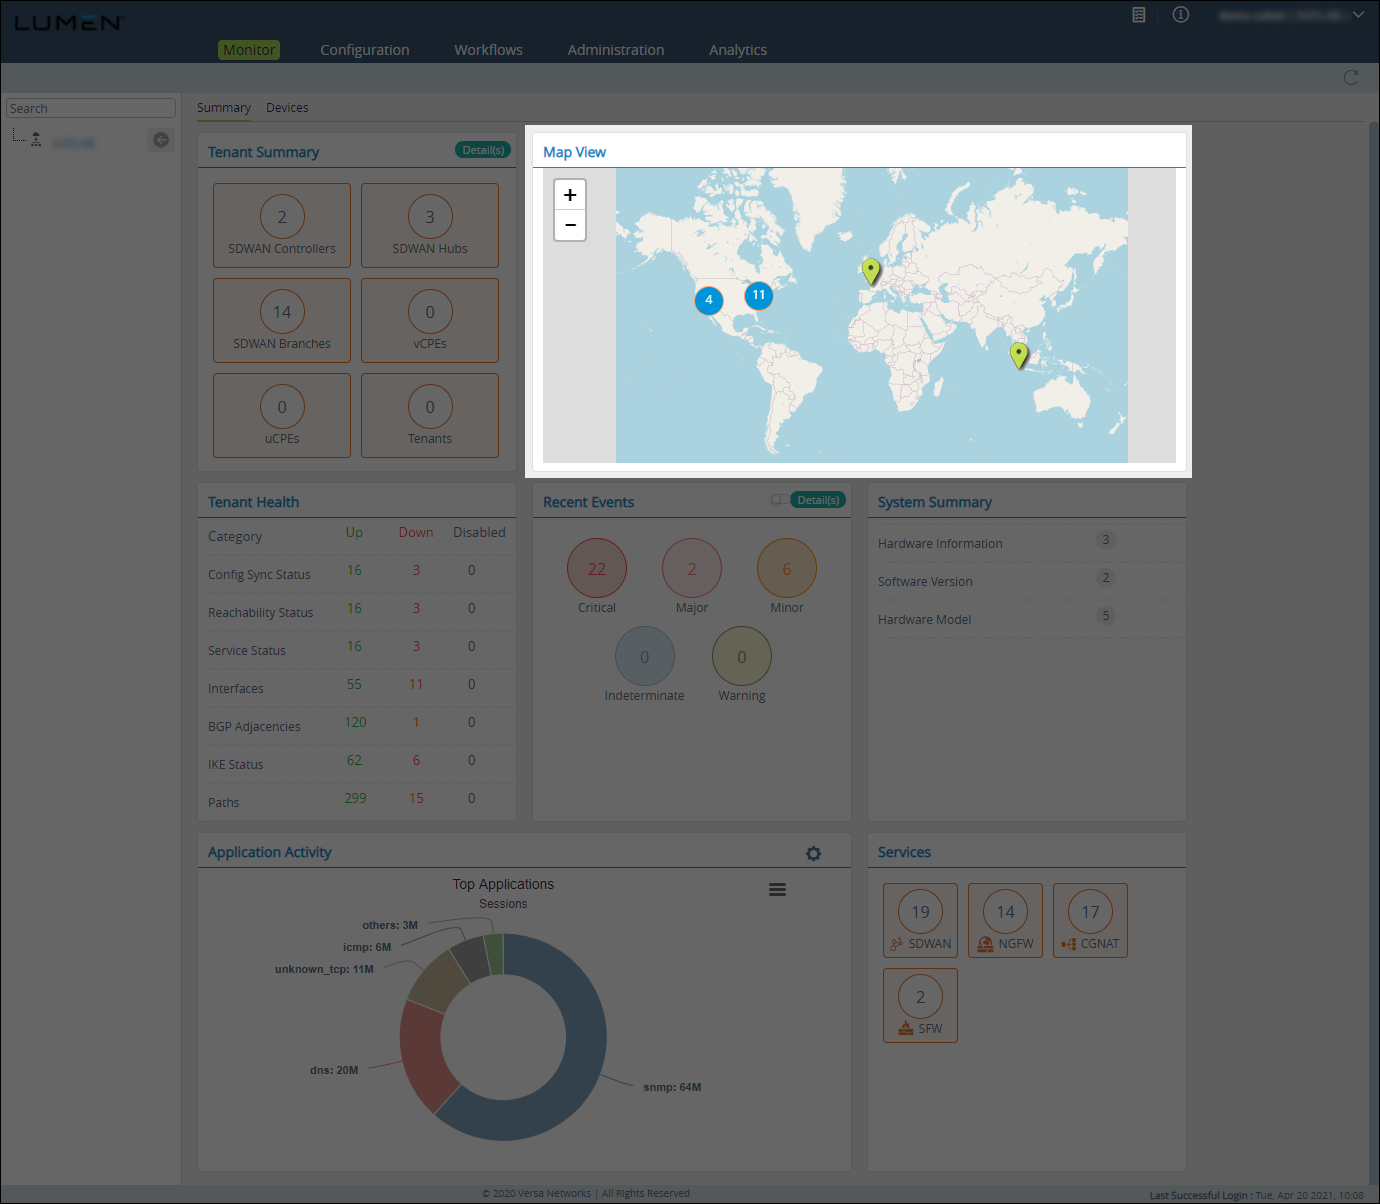
The Tenant Health tile shows summary information of all of your organization's devices:
- Config Sync Status—the number of Versa Director’s device configurations that are in sync with the device.
- Reachability Status—the number of devices reachable via ping or SSH from Versa Director.
- Service Status—the number of device services running in a good state.
- Interfaces—the number of LAN and WAN interfaces and their status.
- BGP Adjacencies—the number of BGP adjacencies in the established, connect, and idle state.
- IKE Status—the number of IKE connections in the up and down state.
- Paths—the number of paths with respect to devices associated in the up and down state.
To view more information, click the row, then:
- To go back to the Tenant Health summary view, click Back.
- To search for a device, click the Search icon.
- To sort the data in ascending/descending order, click the Sort icon.
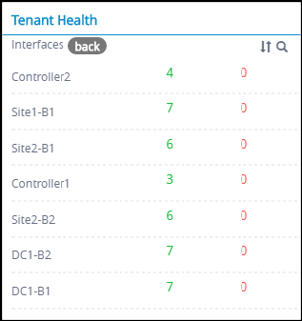
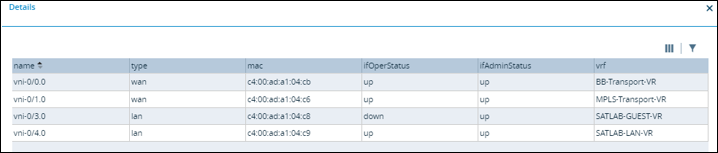
- To view the status for a device, click the row for the device.
The SD-WAN portal shows the device's status.
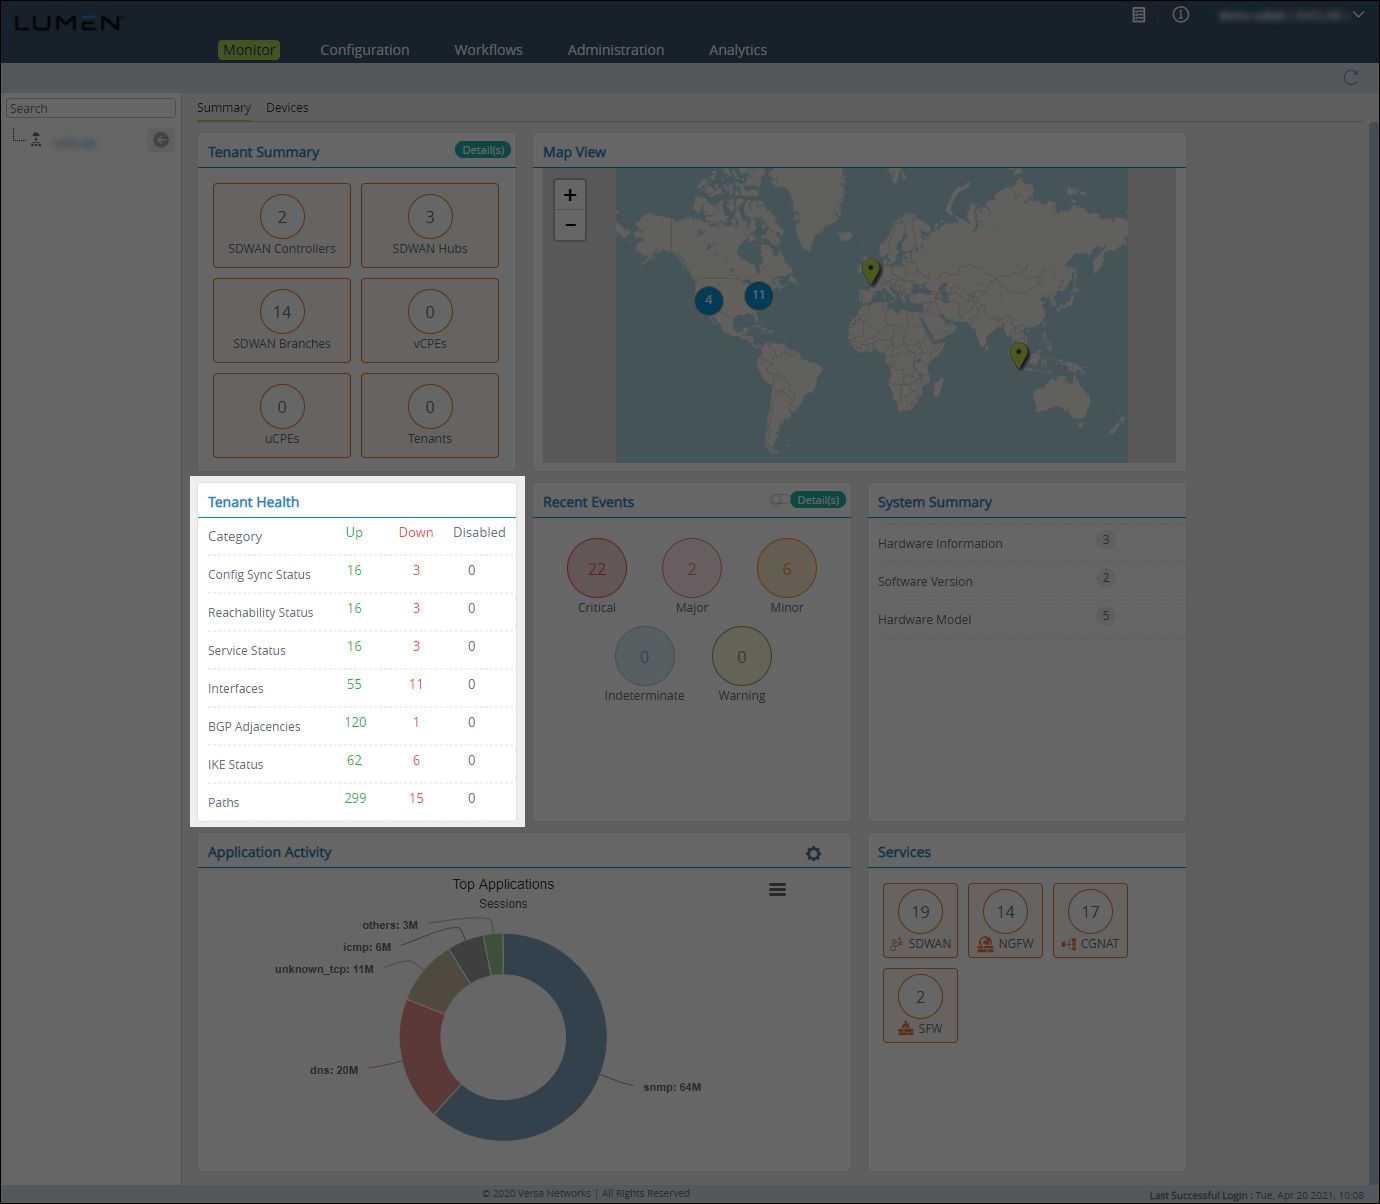
The Recent Events tile shows all the alarms across your organization and its devices. Alarms have multiple levels: critical, major, minor, indeterminate, and warning. For details on an alarm type (including the devices with that alarm), click the bubble for that alarm.
- To view the device information for each alarm type in a table, click Detail.
- To go back to tile view, click Back.
- To select the columns to be displayed, click Column Filter icon.
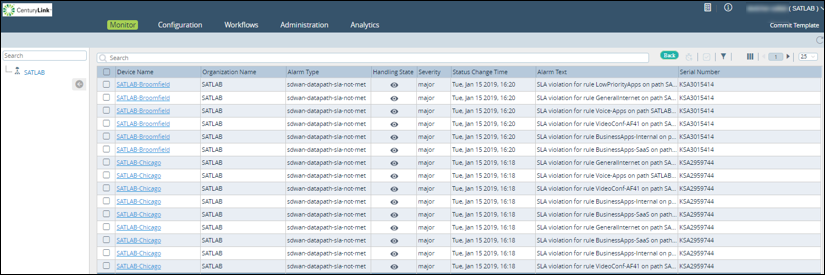
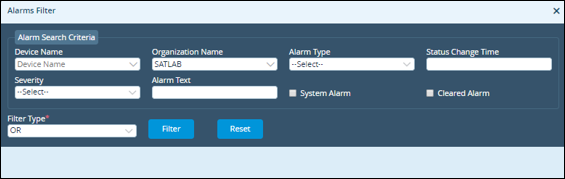
- To filter the alarms you're viewing, click the Alarms Filter icon.
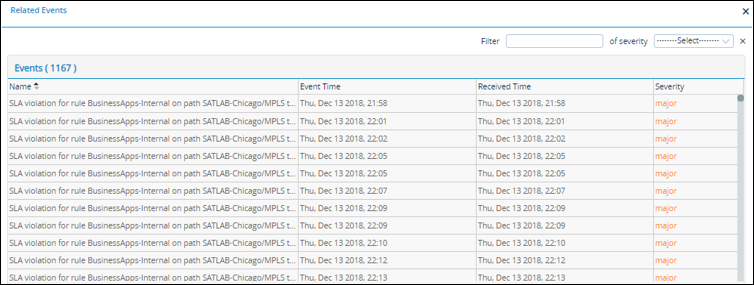
- To see the events list, which shows the alarms raised or cleared, click on the device.
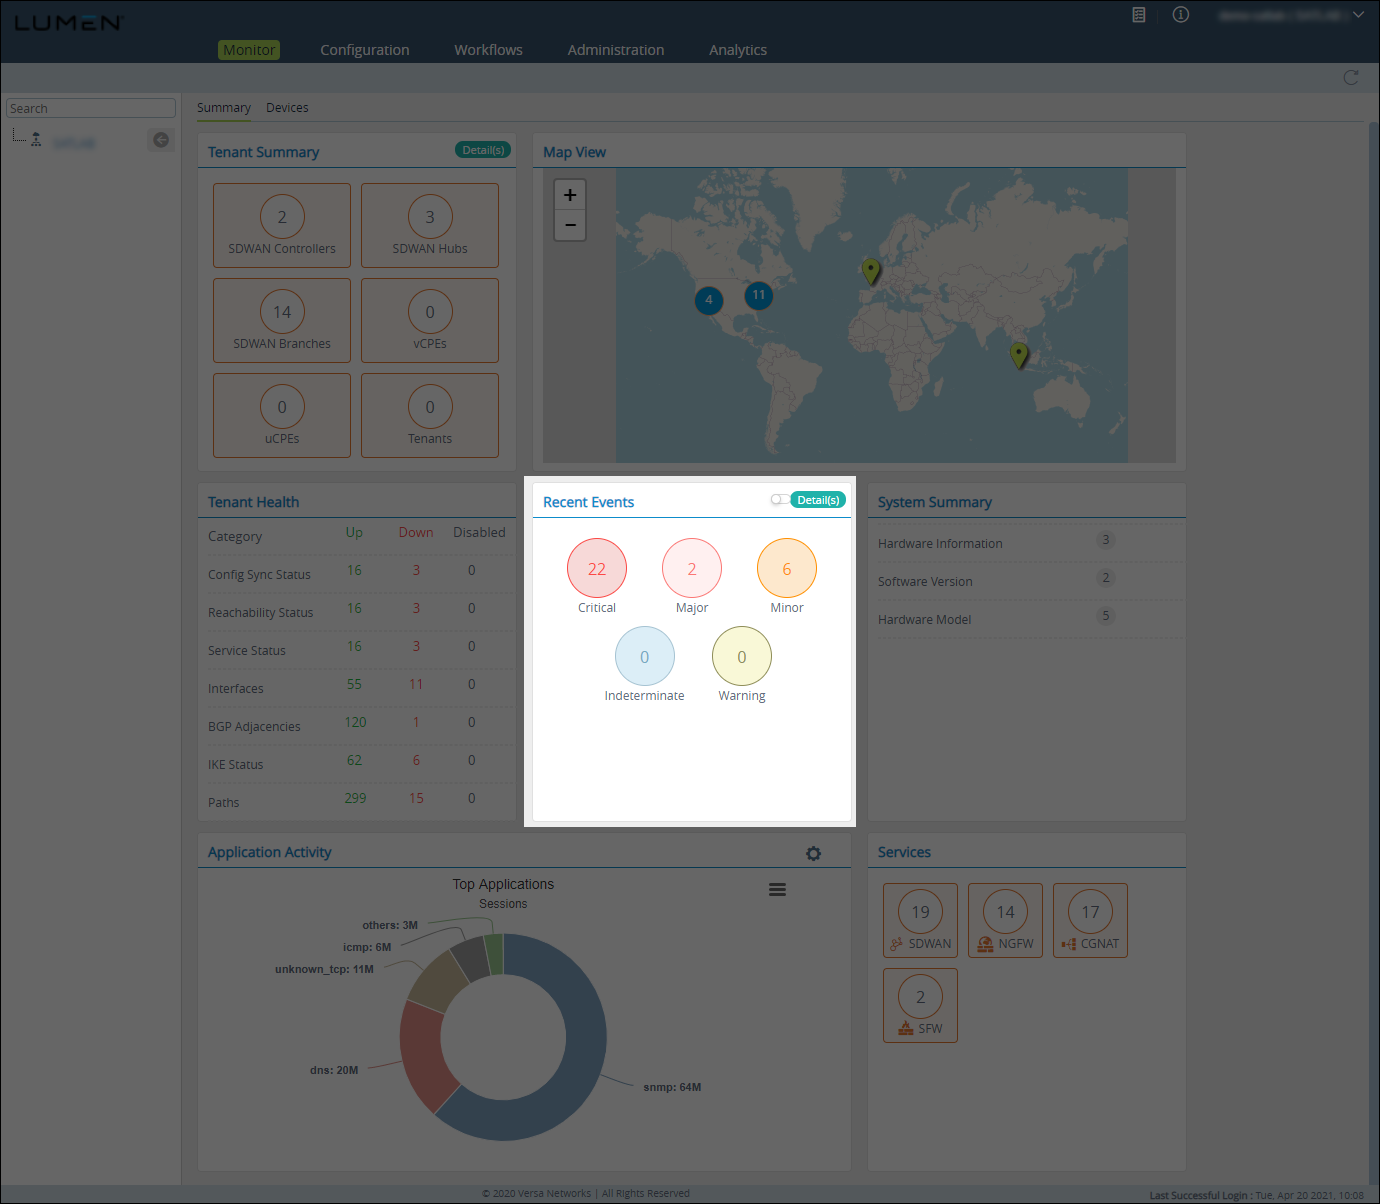
The System Summary tile shows of the number of devices, along with their hardware and software version information.
To get additional information, click the row.
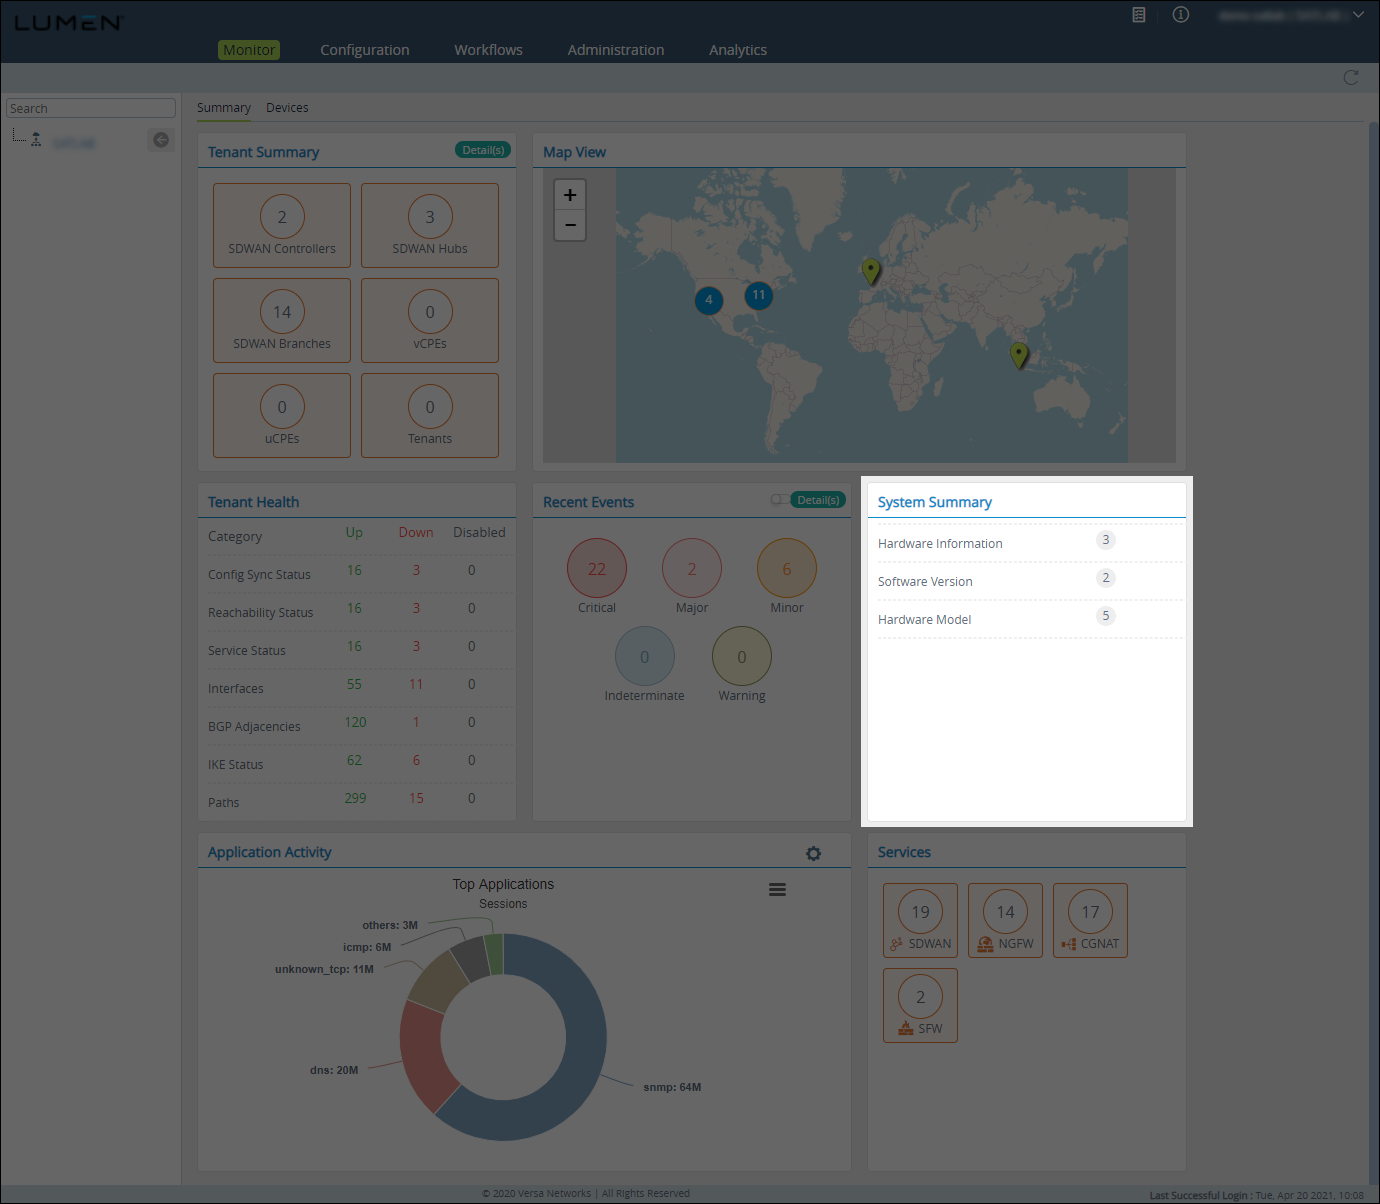
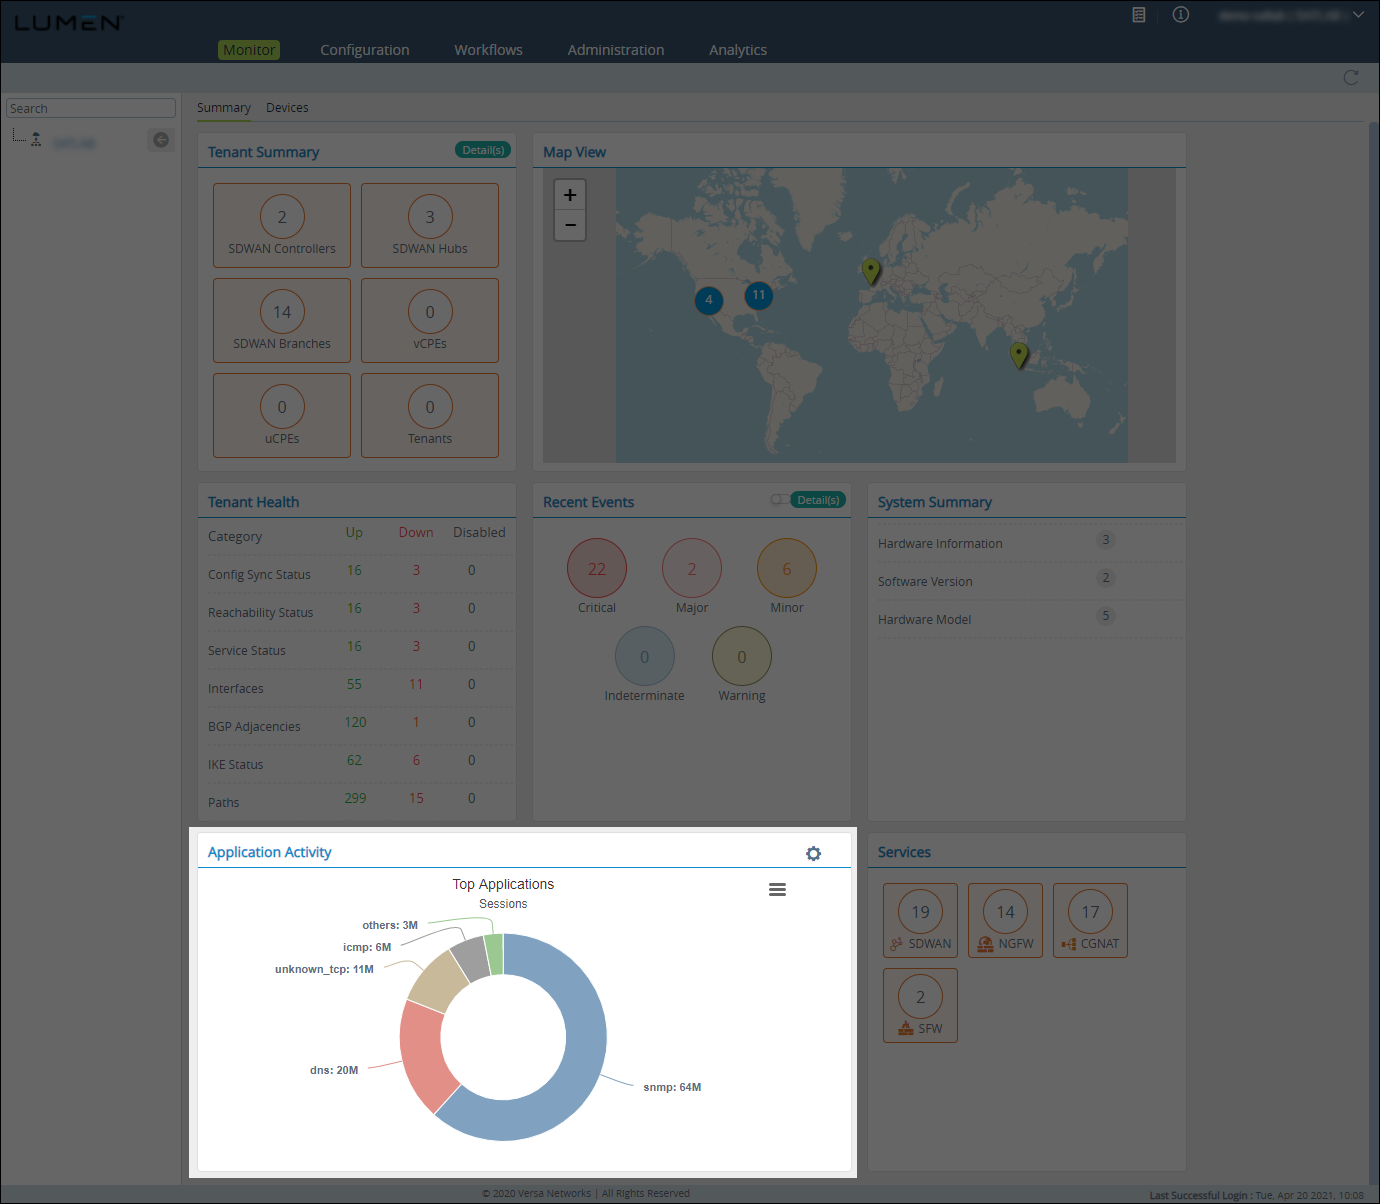
The Application Activity tile shows the top 10 applications used on the device based on these parameters:
- sessions
- transactions
- total bytes forward
- total bytes reverse
To view application activity statistics:
- Click the Settings icon.
- Select a parameter.
The Application Activity tile shows the break-up for each application.
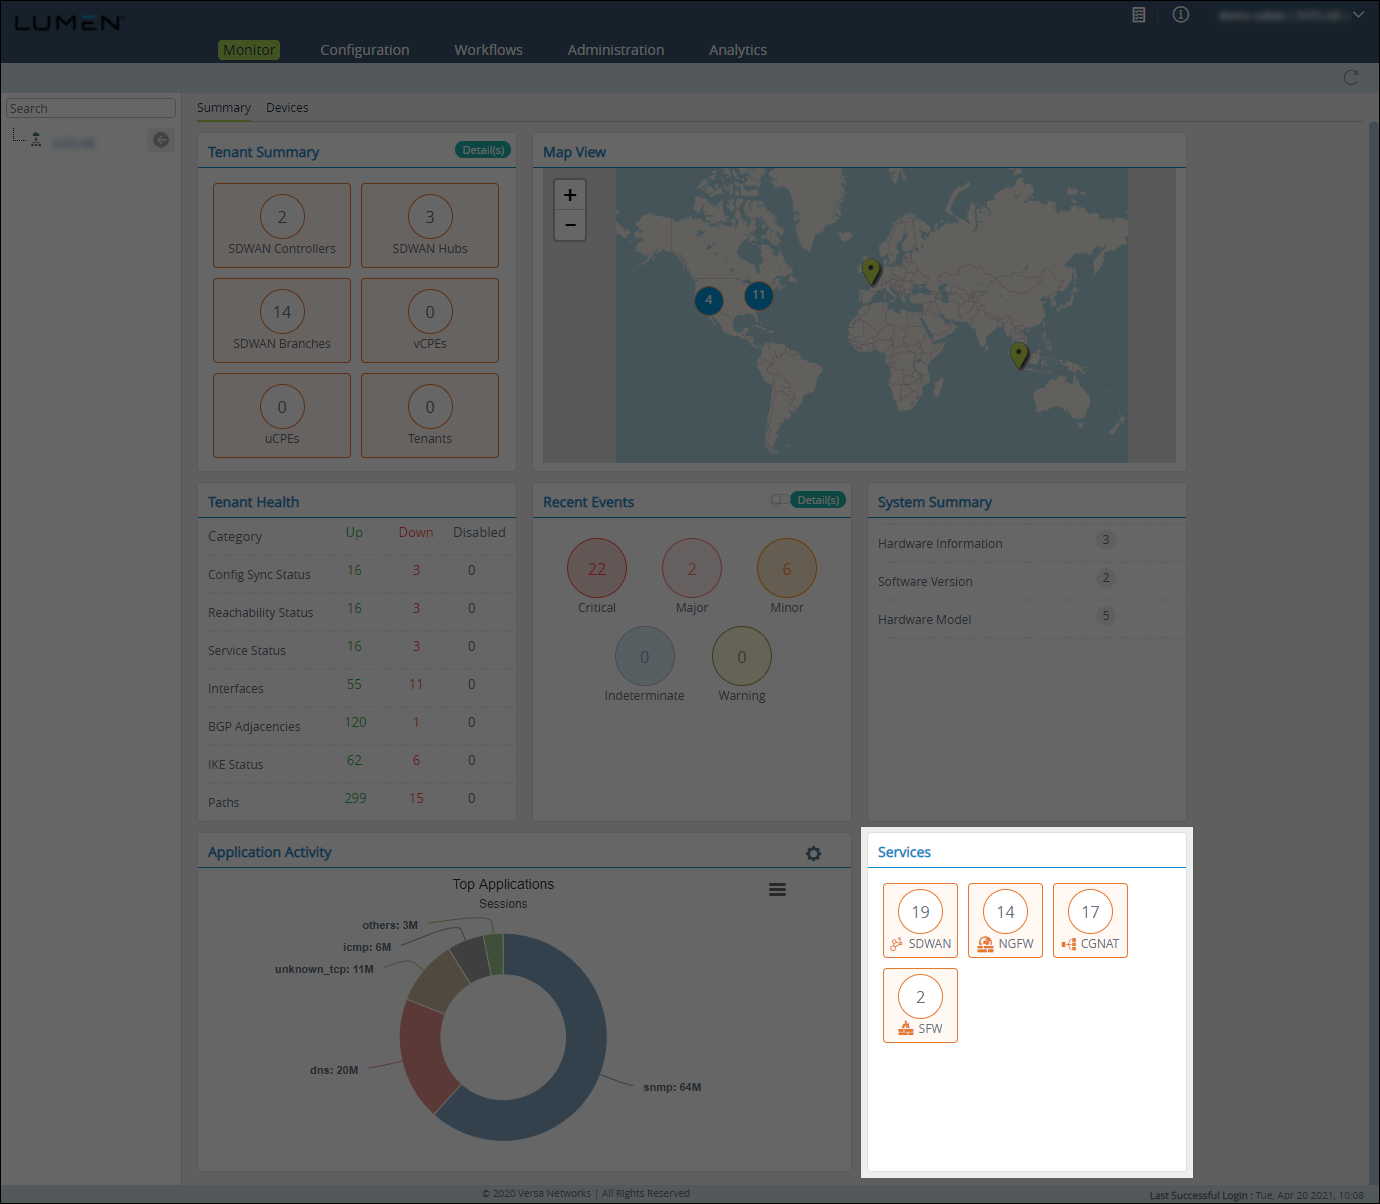
The Services tile shows the total number of services turned on for your organization and associated devices.
Appliance overview
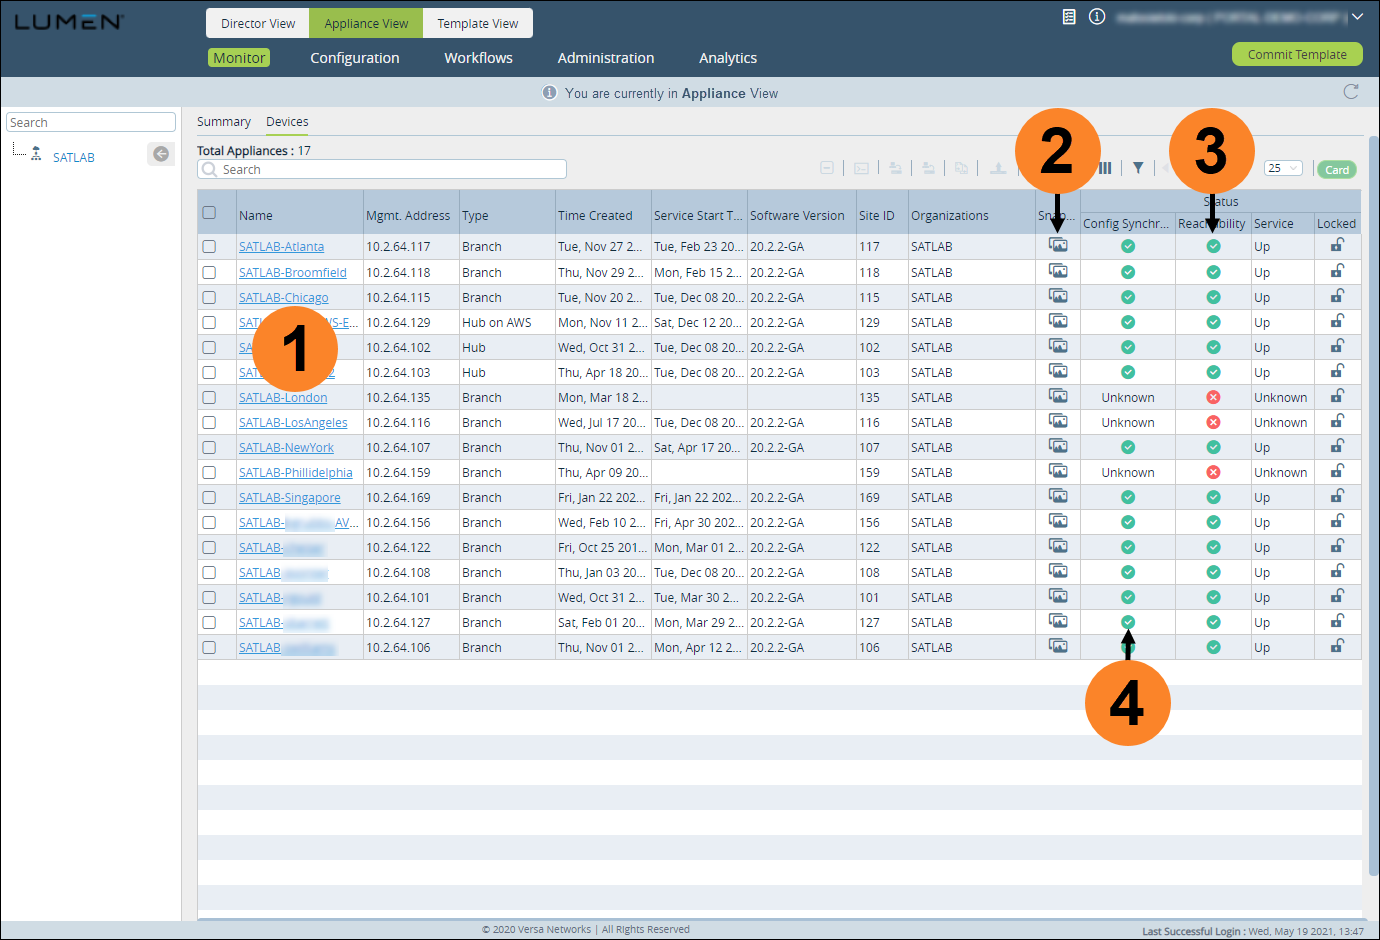
Use the Devices subtab to get an overview of your appliances: view a list of your appliances, then get more information about each appliance, such as services on the appliance, etc.
Appliance list
The appliance list shows your deployed appliances and whether they are reachable from the Director. You can also view the deployed configuration and take a snapshot or restore the appliance configuration should you change it.
To view the appliance list, click the Monitor tab, then click the Devices subtab. (You can also view the appliance list by clicking the Configuration tab, and then Devices.)
- Appliance summary (click to view a summary of an appliance).
- Manage appliance configuration snapshots.
- Appliance reachable from Director.
- Appliance up to date with templates.
To view a summary of one of your appliances, click the blue hyerlink for the appliance (in the Name column).
Use the sections below to explore the information available for each appliance:
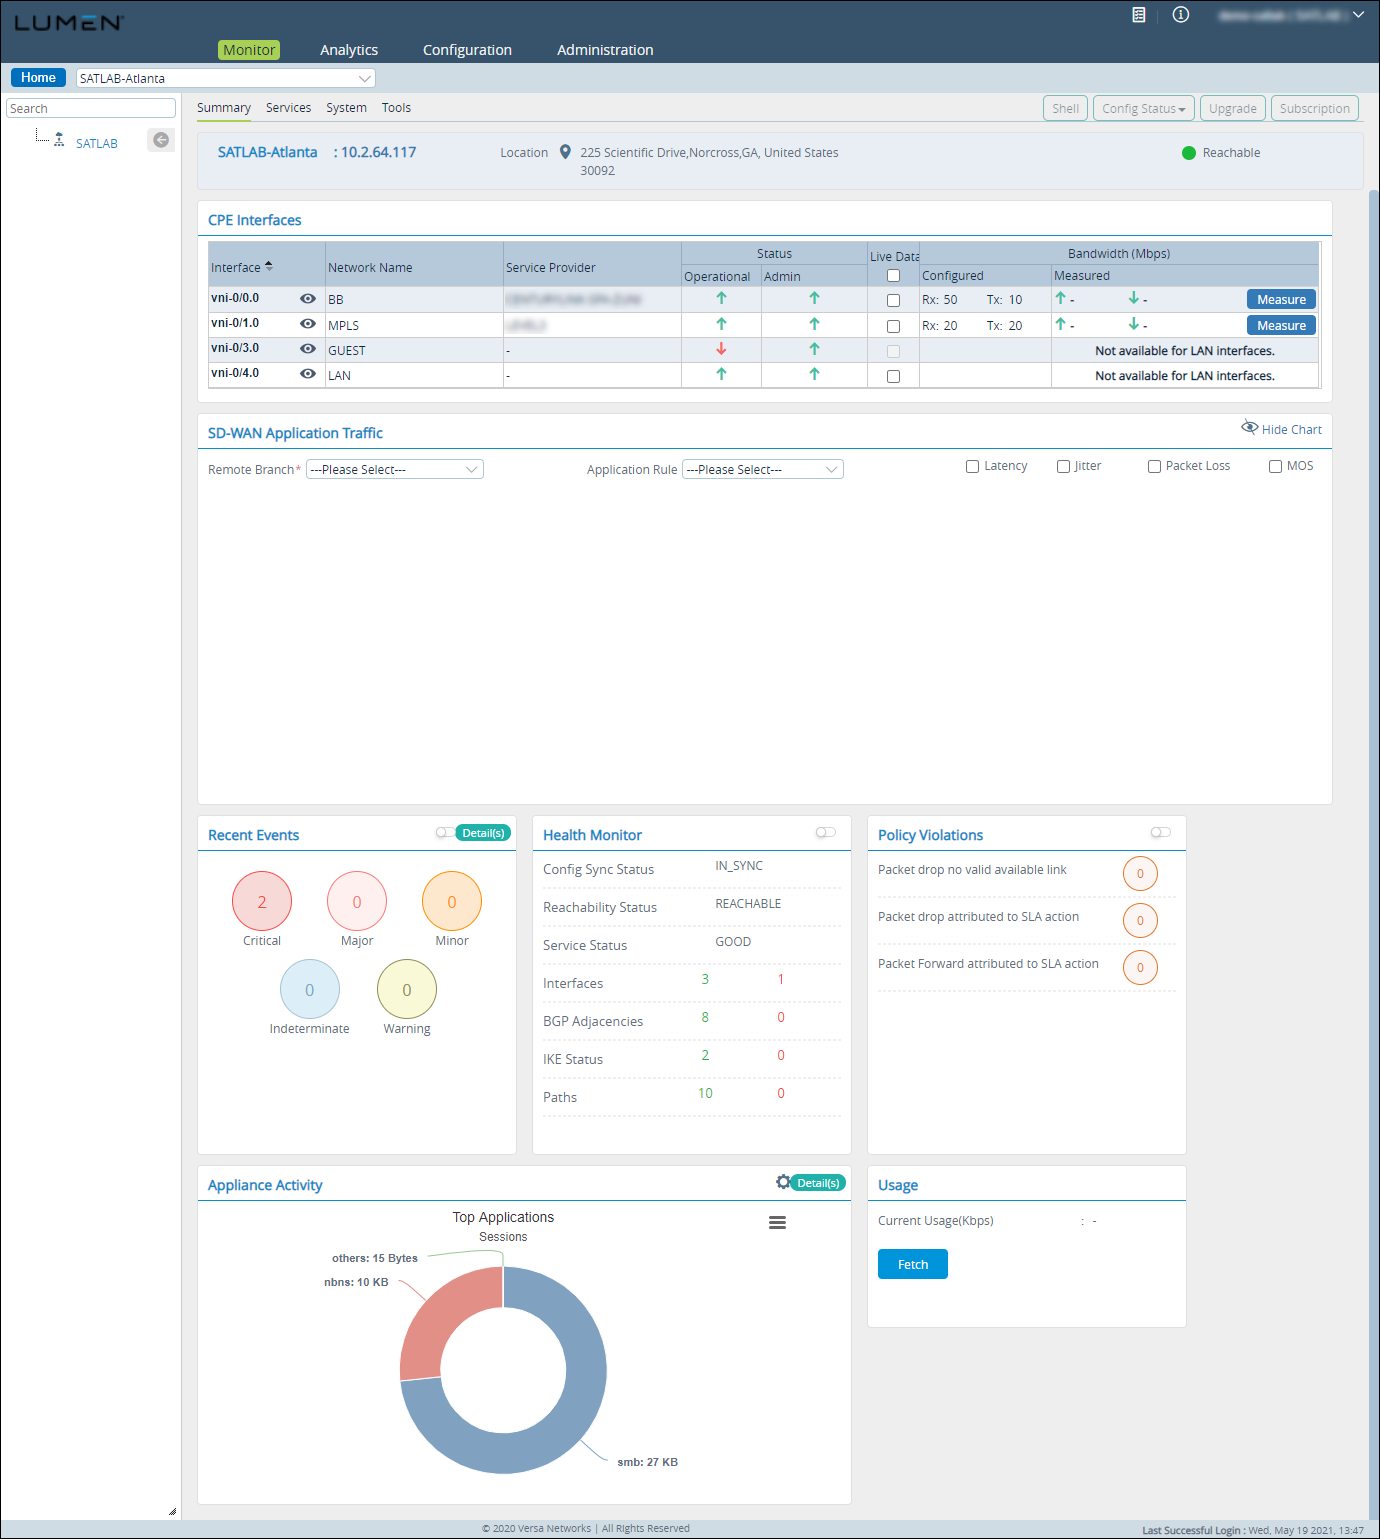
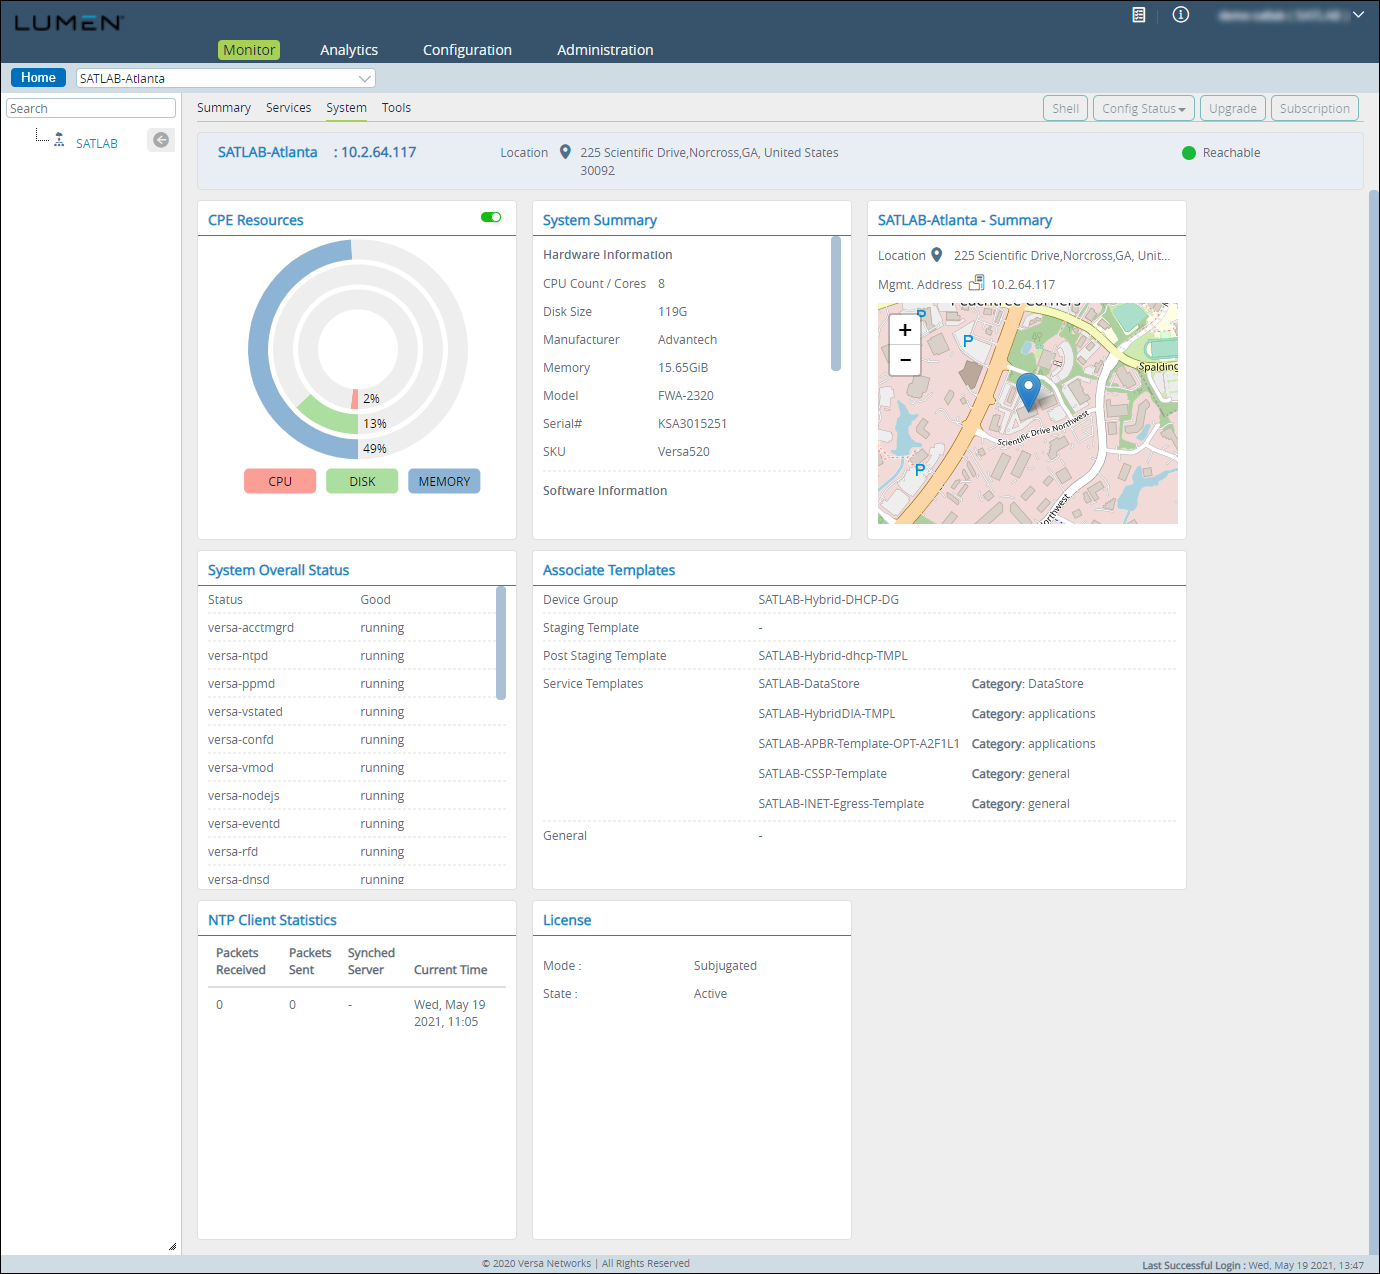
To view a snapshot of the device, click the Summary subtab. Versa Director shows the following tiles to summarize the device:
- CPE Interfaces tile—A breakdown of interfaces and the traffic that is going over them in four second increments. This can be for all traffic or all SD-WAN traffic. To view interface details, click the eye icon (next to the interface name):
- IP address. Configured and public IP, if different
- Current RX/TX bps
- Configured RX/TX bps
- VRF
- SD-WAN Application Traffic tile—A filtering option to look at a specific SD-WAN traffic flow between FlexVNF’s and gives the ability to see SLA performance in real time. Under SD-WAN Application traffic, you can look at an aggregate of all SD-WAN traffic to a specific branch, along with looking at traffic for a specific SD-WAN policy. Traffic counters will be displayed in the same 4 sec increments as the CPE interfaces section. If a SD-WAN policy and branch is selected, you can also see the associated SLA metrics and the thresholds that are set to deem that link out of policy.
- Recent Events tile—recent alarms received from the FlexVNF.
- Health Monitor tile—current health of the FlexVNF looking at:
- Is the configuration on the device in sync with the template on Director.
- Versa Director's reachability to the remote FlexVNF
- Versa services status
- Number of interfaces: up or down
- Number of BGP adjacencies: up or down
- IKE status: up or down
- SD-WAN paths: up or down
- Policy Violations tile—any SD-WAN policy violations occurred on that device.
- Appliance Activity tile—top applications going through the FlexVNF.
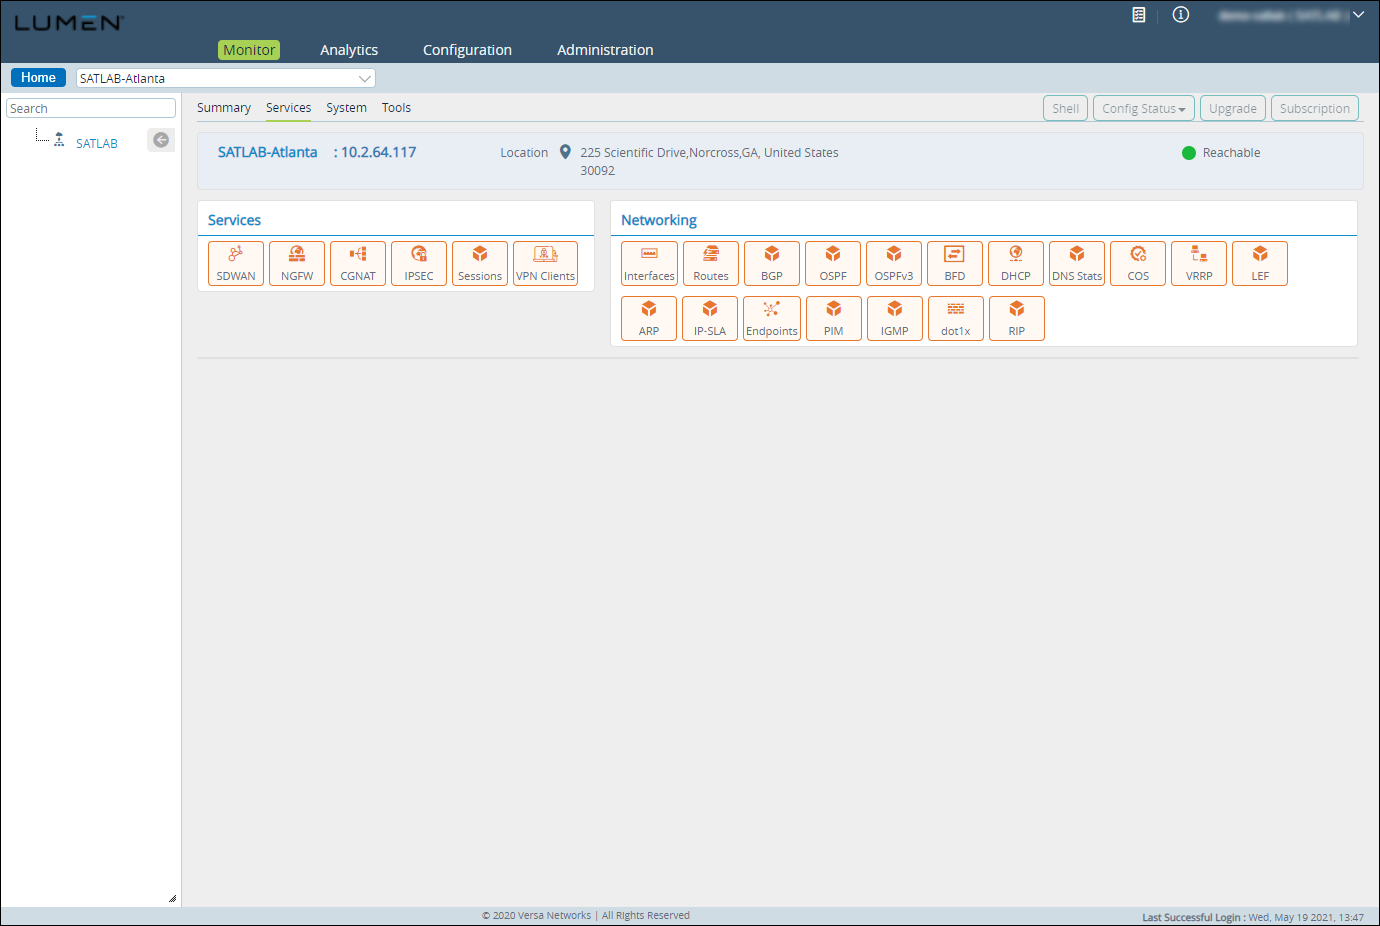
The Services subtab is a quick way to get information from a branch FlexVNF without having to sign in to the CLI and run a command. This is useful for an operations teams to track down an issue as well as for daily operational tasks—including looking at traffic flows or seeing the health of IPSec tunnels. The items shown on the Services subtab fall under two categories: Services and Networking.
Services: SDWAN
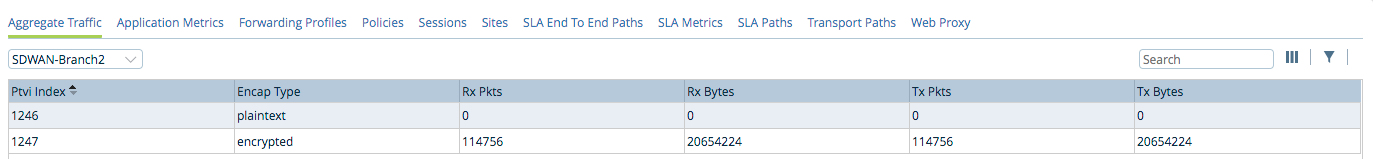
- Aggregate Traffic—From the branch you are on to another branch or a controller, you can look at the aggregate amount of traffic that has traversed over the encrypted or plain-text tunnels.
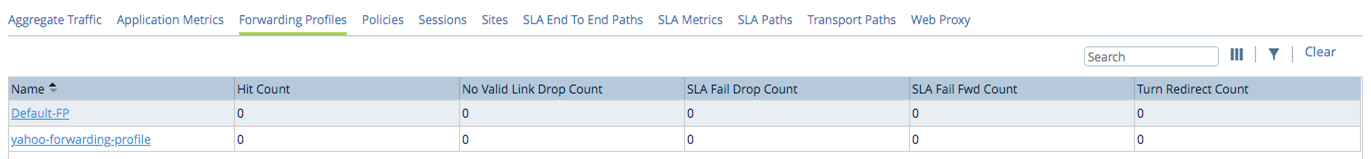
- Forwarding Profiles—The screen displays the forwarding profile statistics. The data includes the profile name, hit count, valid link drop count, SLA fail drop count, SLA fail forward count, and turn redirect count.
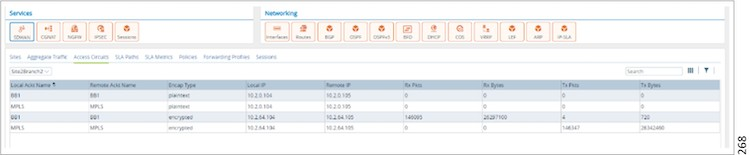
- Access Circuits—From the branch you are on to another branch or a controller, you can look at each transport and see how much data has traversed over the plain-text or encrypted tunnels.
- Policies—How many times a policy has been hit and the transmit and receive bytes/packets.
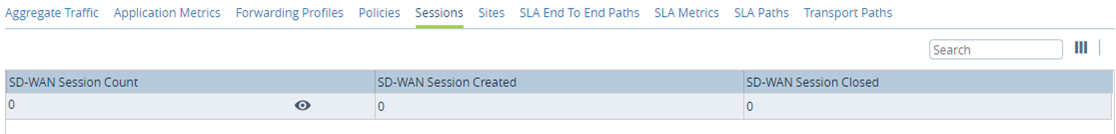
- Sessions—Active number of SD-WAN sessions going through the local FlexVNF. Clicking the eye icon lets you search for SD-WAN sessions by supplying any one of the following criteria to search for:
- Source IP address/prefix
- Source port
- Destination IP address/prefix
- Destination port
- Protocol
- Predefined application
- Predefined URL category
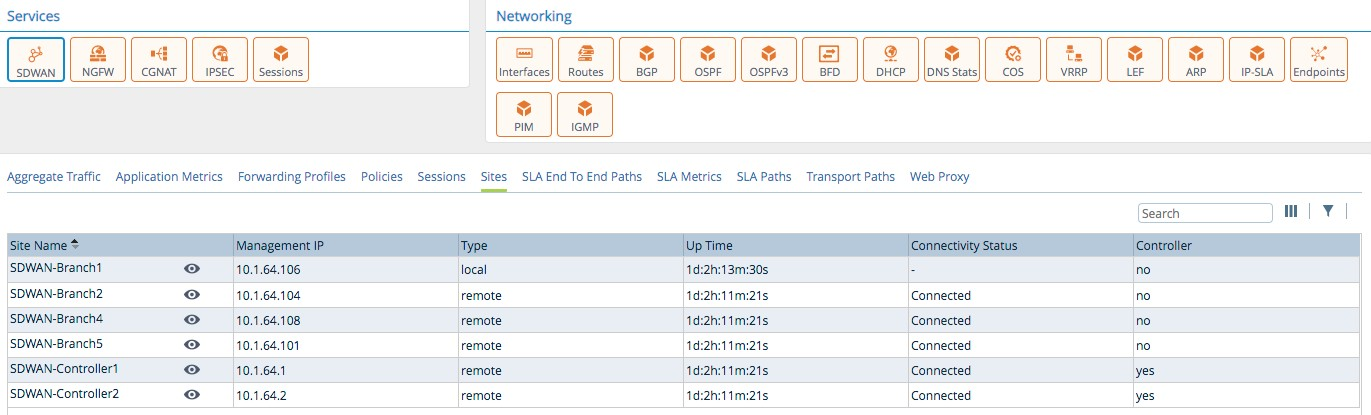
- Sites—All the SD-WAN sites this specific branch has connectivity to.
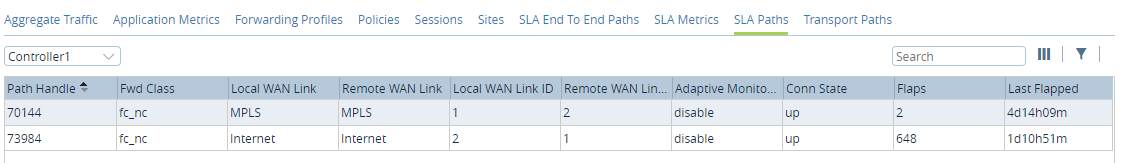
- SLA Paths—From the branch you are on to another branch or a controller, you can look at what the current SLA paths by forwarding class to see if they are up, the last time they flapped and if adaptive monitoring is active or not.
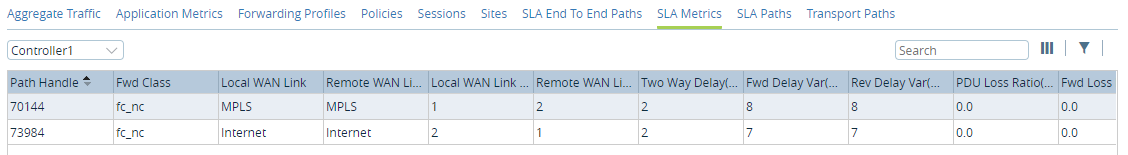
- SLA Metrics—From the branch you are on to another branch or a controller, what the current SLA metrics are between the devices.
Services: NGFW (next-generation firewall)
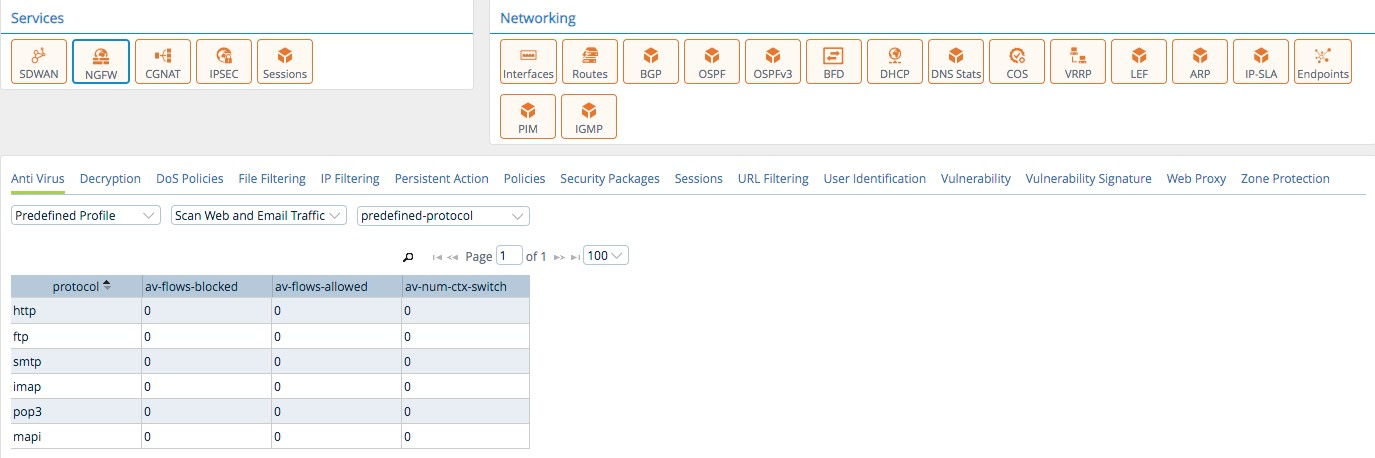
- Antivirus—select the antivirus type, for example User Defined Profile, from the list. Select the scanning profile from the list. Select the profile type from the list.
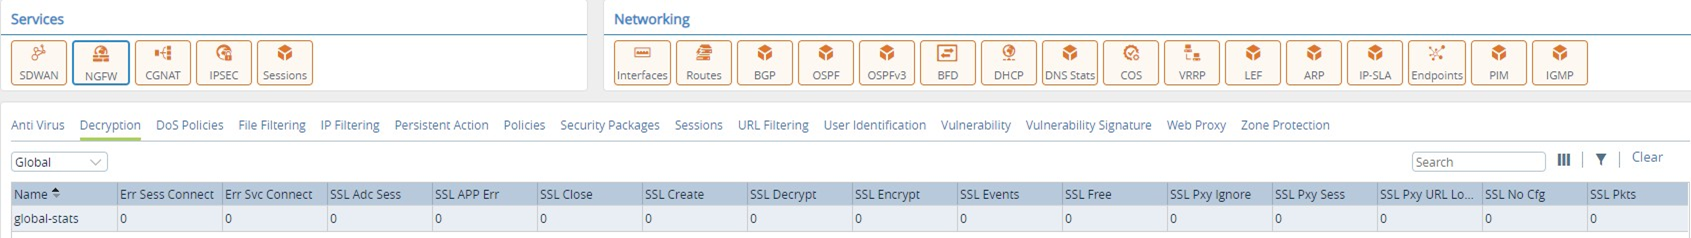
- Decryption—shows the decryption filter, with the following choices.
- Global—displays all the decryption data within the associated organization.
- Profile—displays the decryption data associated with user-defined profiles.
- Policy—displays the decryption data associated with user-defined policies.
- Global—displays all the decryption data within the associated organization.
- DDoS—shows the DDoS policy details.
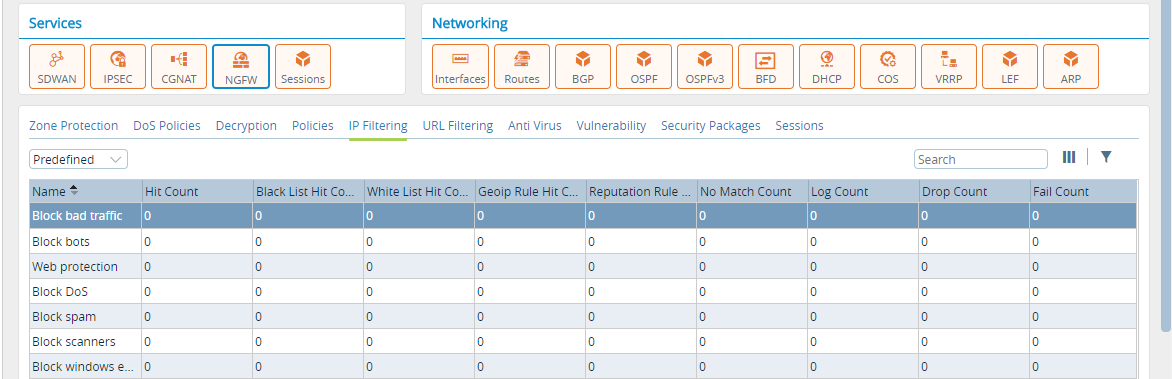
- IP Filtering—shows predefined or user-defined IP filtering policies.
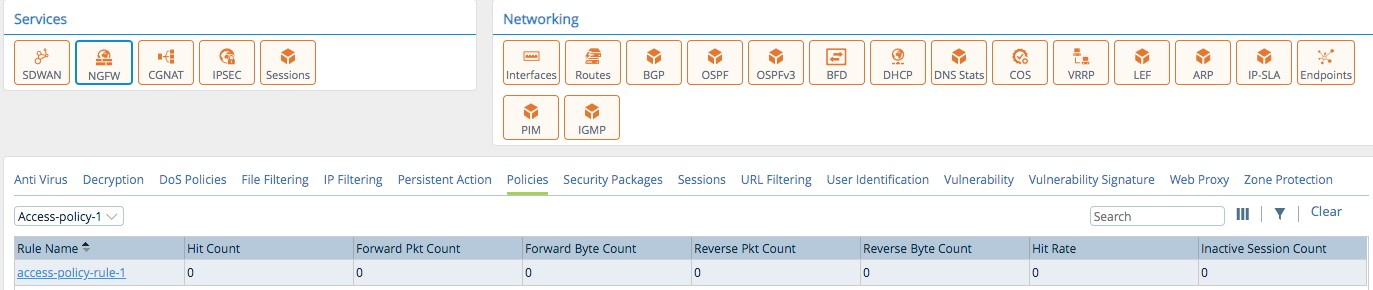
- Policy—shows the hit count, forward packet/byte count, reverse packet/byte count, hit rate, and inactive session count for configured NGFW rules.
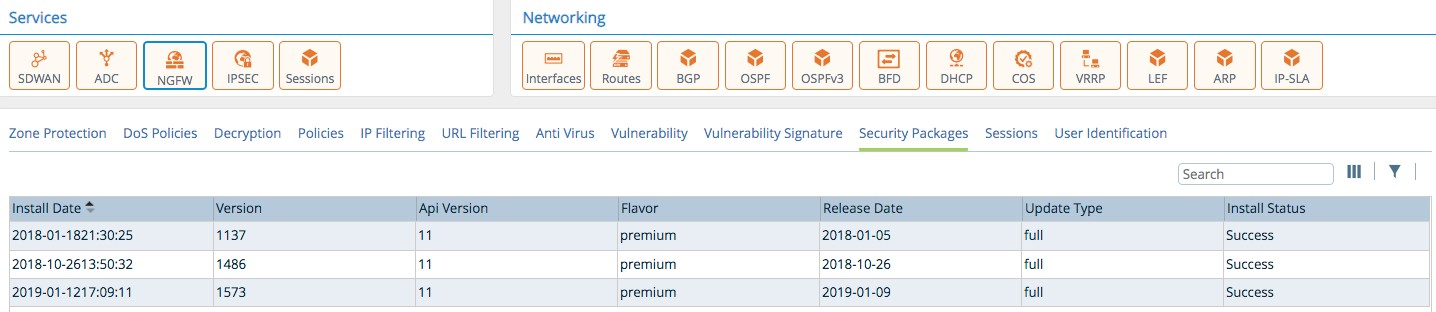
- Security Packages—security package details. The details include the installation date, version, flavor, release date, update type, and installation status.
- Sessions—Refers to vulnerable sessions during the current system up time.
- URL Filtering—shows URL filtering for the following:
- Profile—Displays URL traffic data associated with user-defined profiles.
- Global—Displays URL statistics based on the total URL traffic in an organization.
- User Category Predefined—The Security Administrator can apply various types of policies based on the predefined URL categories.
- User Category User-defined—The Security Administrator can create user-defined URL category objects for certain URLs and override predefined URL categorization values.
- URL Reputation Predefined—The Security Administrator can filter websites based on their predefined reputation values.
- URL Reputation User-defined—The Security Administrator can define URL reputation values and filter websites.
- Profile—Displays URL traffic data associated with user-defined profiles.
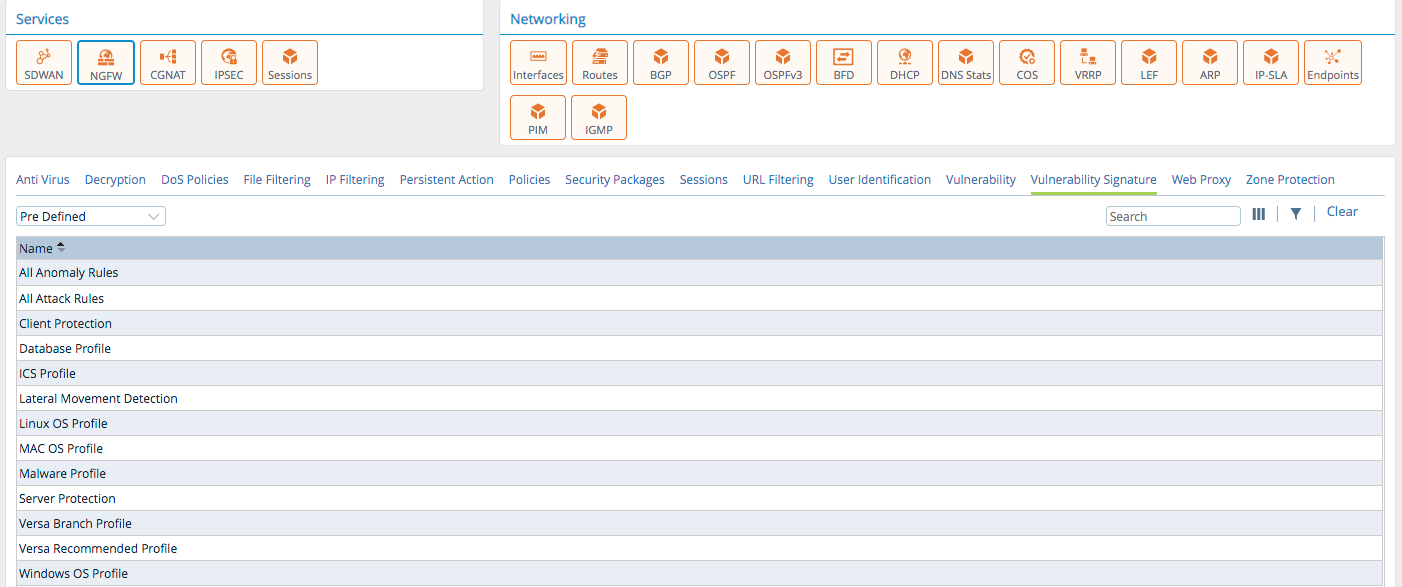
- Vulnerability—select the type of vulnerability profile from the list to view details:
- User Defined—refers to profiles as defined by an administrator.
- Pre Defined—refers to system-defined profiles.
- Vulnerability Signature—lets the administrator look into a profile/rule to see what vulnerabilities it is protecting against. Clicking view shows you what signature ID is associated with the policy.
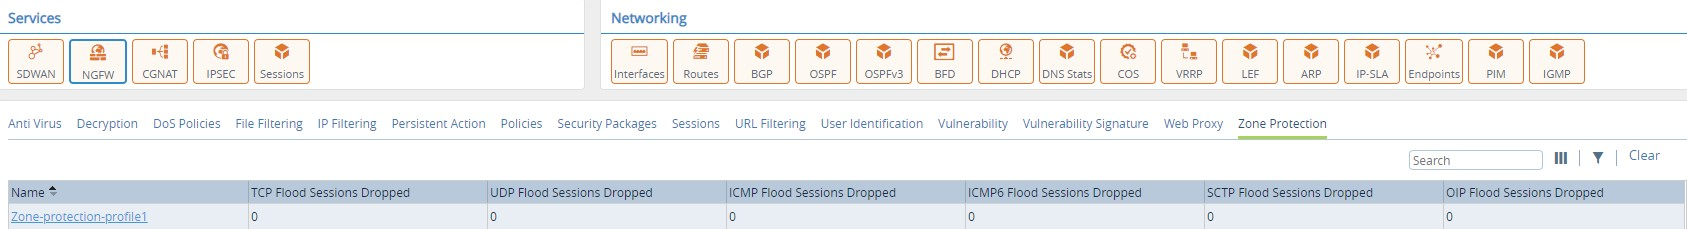
- Zone Protection—shows the statistics of zone protection profiles.
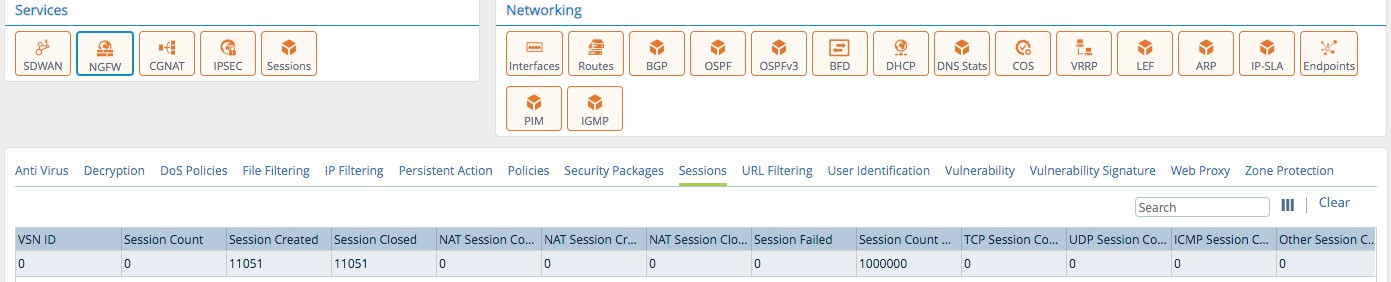
- Sessions—NGFW session details. The details include the total number of NGFW sessions, number of sessions created, number of sessions closed, total number of NAT sessions, number of NAT sessions created, number of NAT sessions closed, and number of NAT sessions failed.
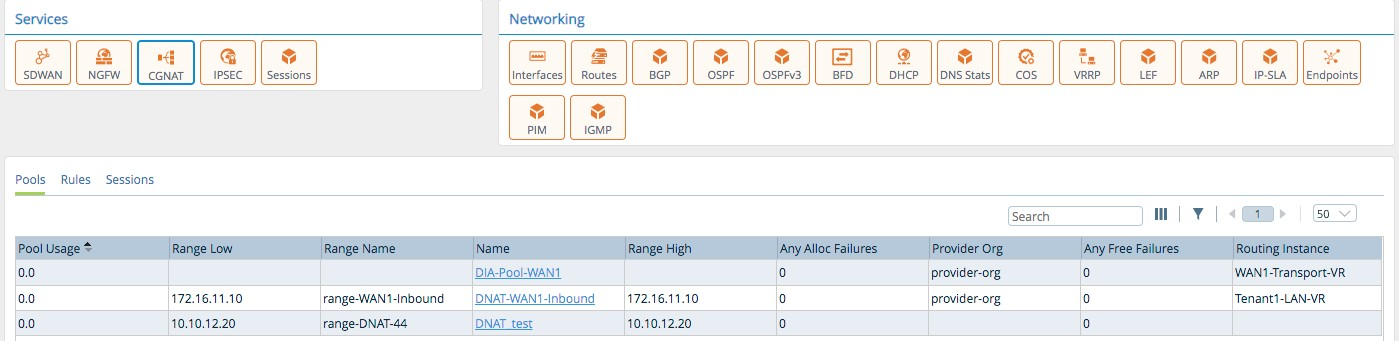
Services: CGNAT
- Pools—configured pool usage.
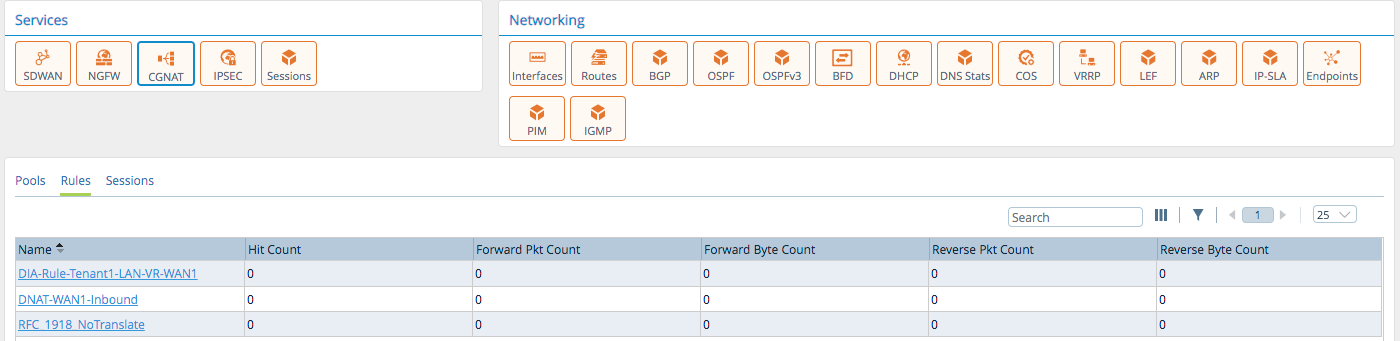
- Rules—hit count, forward packet/byte count, and reverse packet/byte count for configured rules.
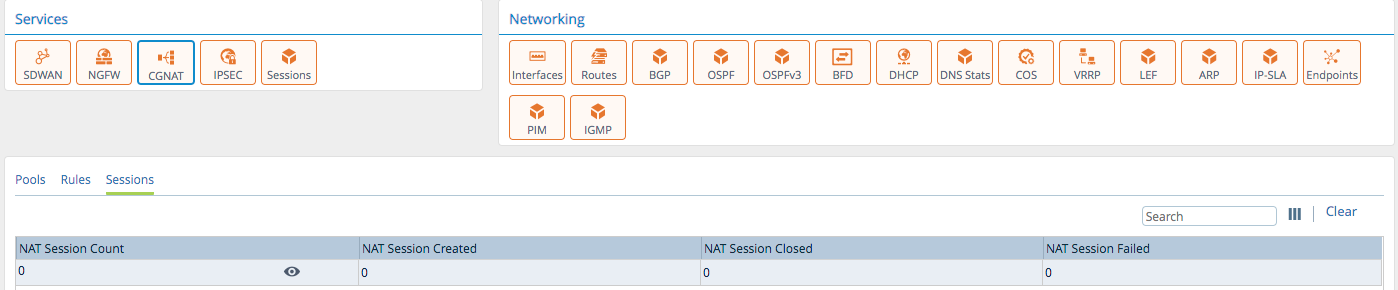
- Sessions—NAT sessions created. Clicking on the eyeball, lets you search for CGNAT sessions by supplying any one of the following criteria to search for:
- source IP address/prefix
- source port
- destination IP address/prefix
- destination port
- protocol
- predefined application
- predefined URL category
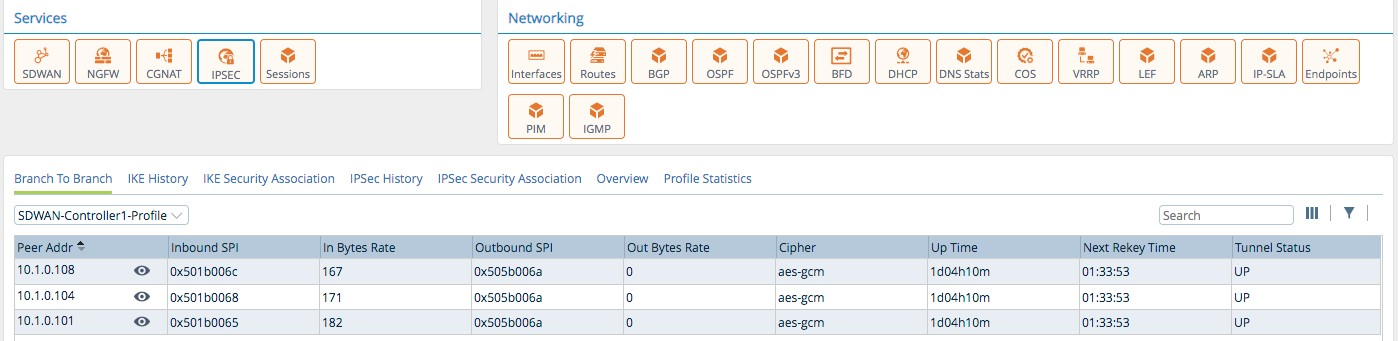
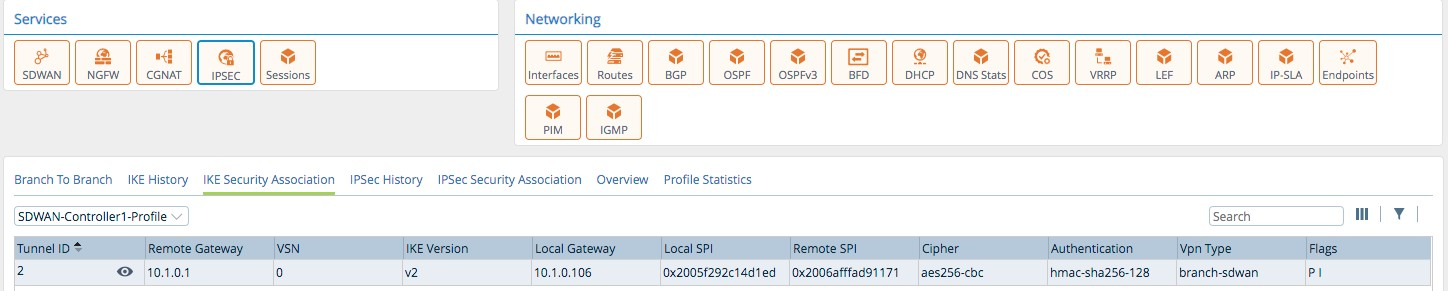
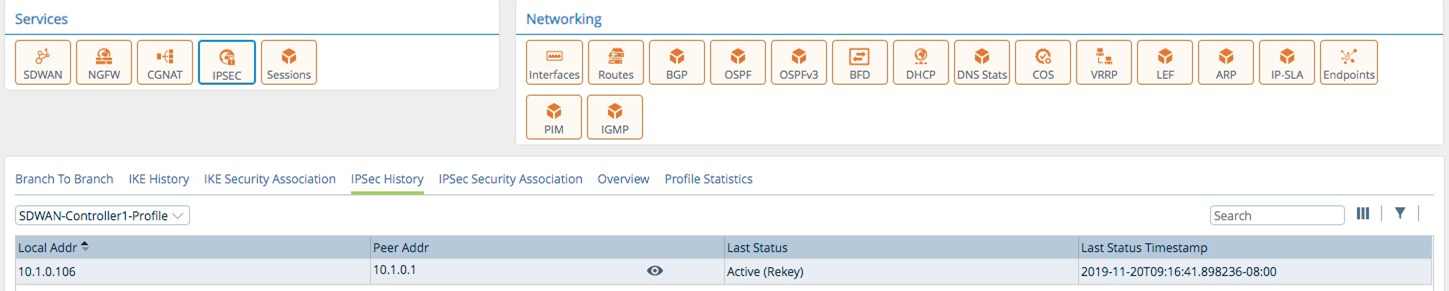
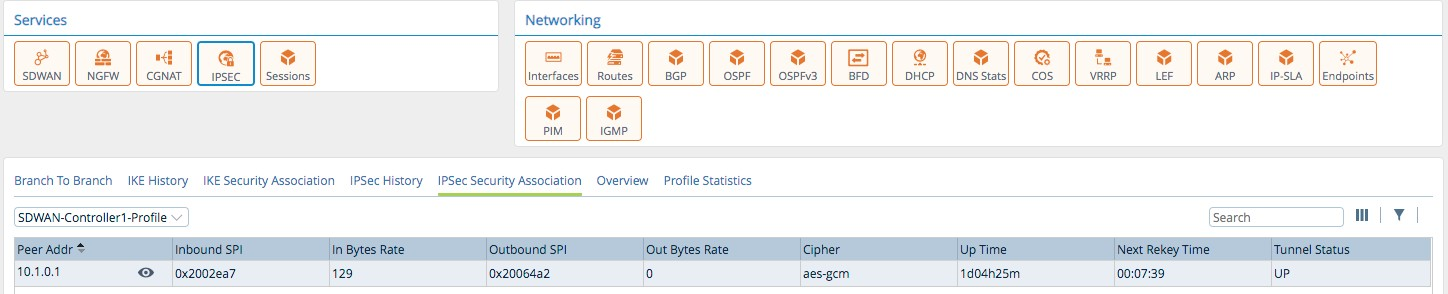
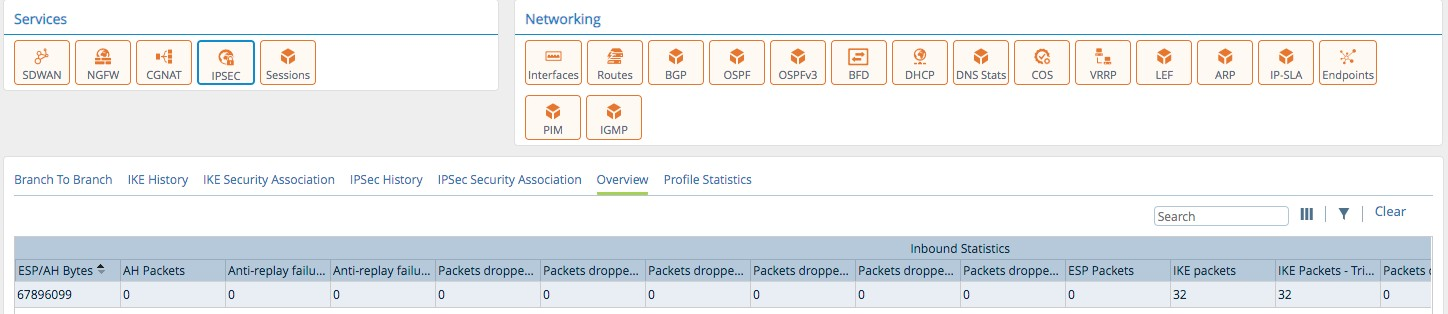
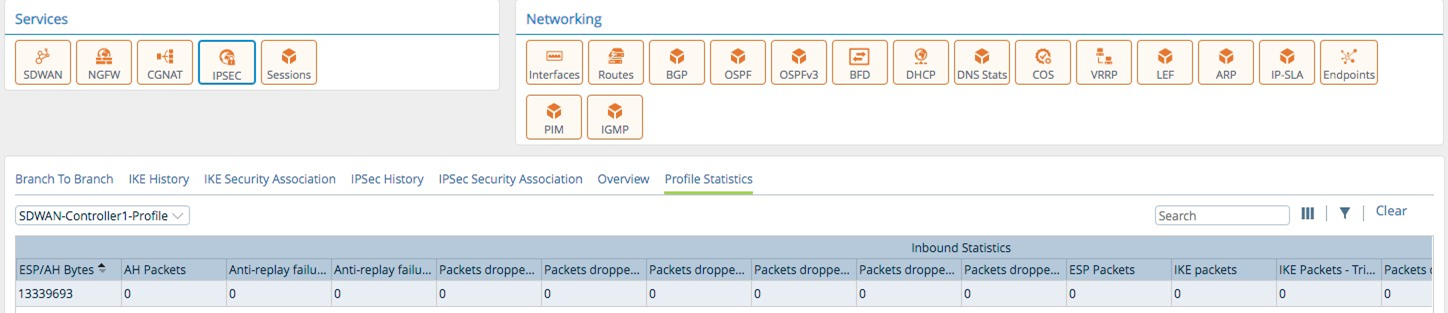
Services: IPSEC
- Branch to Branch—connection details from a IPSEC Profile view.
- IKE History—IKE history from an IPsec Profile view.
- IKE Security Associations—IKE SA details from an IPsec Profile view.
- IPsec History—IPsec History IPsec Profile view.
- IPsec Security Associations—IPsec SA details from an IPsec Profile view.
- Overview—the IPsec details of the local FlexVNF.
- Profile Statistics—profile statistics from the local FlexVNF based on a IPsec Profile view.
Services: Sessions
Allows you to look at any session tables for SDWAN, CGNAT, and NFGW and to search across all session tables.
Networking: Interfaces
- Interfaces—the WAN and LAN interface statistics with respect to the organization associated with the device. The table displays the latest cumulative values at the time of polling after the interface is activated, unless a clear operation is performed. The PPS (packets per second) and BPS (bits per second) counters average out over a maximum of 30 seconds. The PPS and BPS numbers represent the observable rate of a stable flow. For example, if the traffic drops to zero at the 20th second, the value of these averages will drop to zero as well, and will not use the values of the first 20 seconds to calculate the rate.
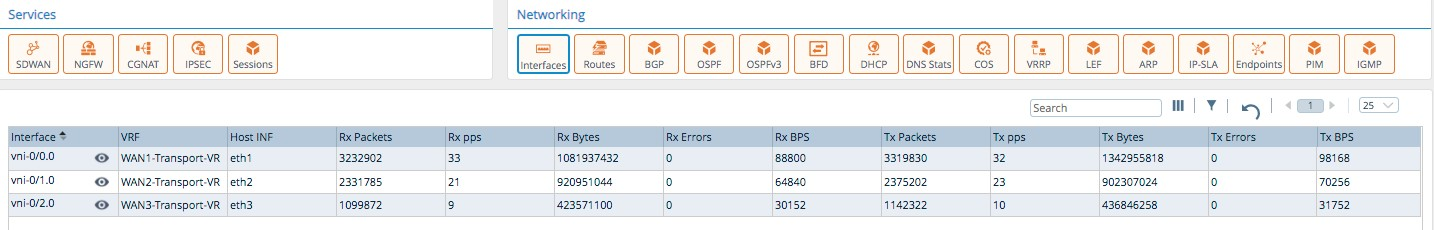
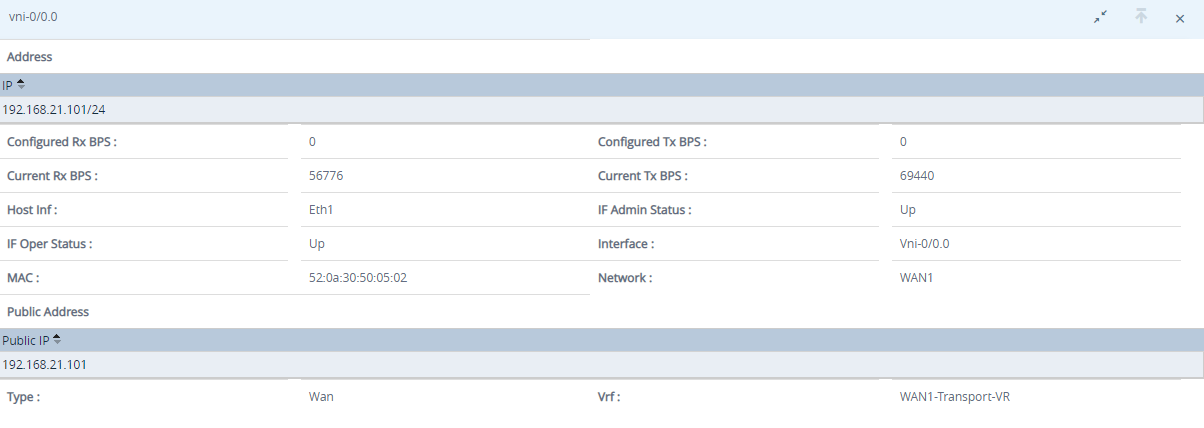
Click the eyeball to view the configured IP address, VRF, interface status, and type.
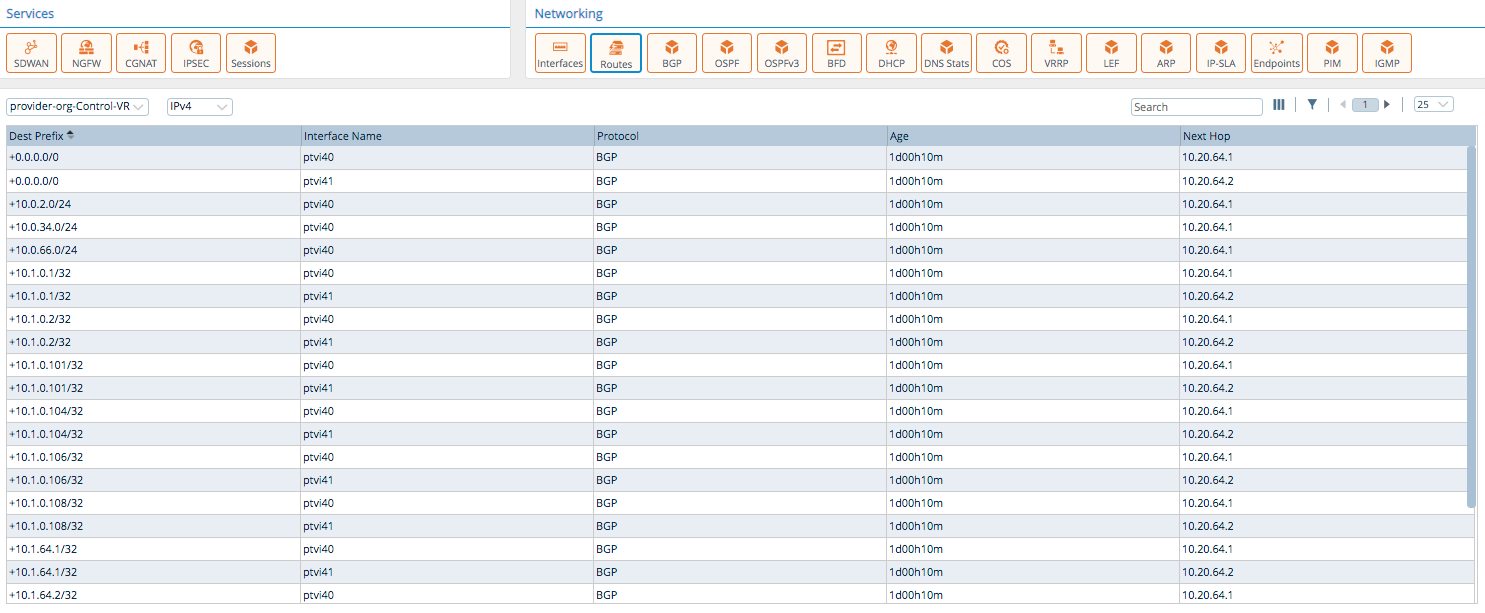
- Routes—show either IPv4 or IPv6 routes from a specific routing instance.
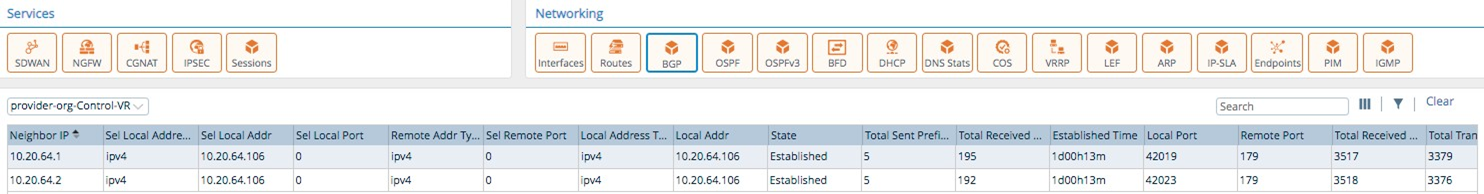
- BGP—show BGP neighbor adjacencies from a specific routing instance.
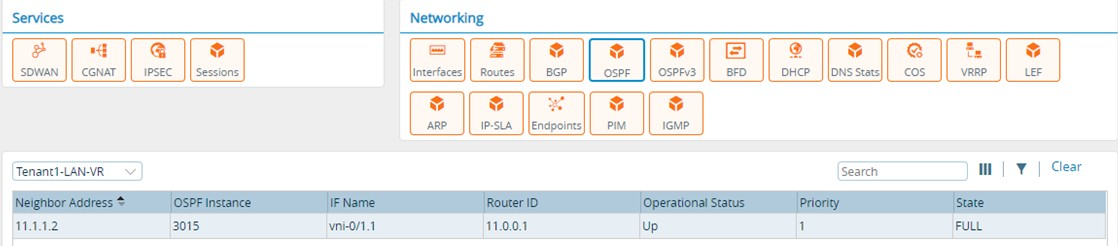
- OSPF—show OSPF neighbor adjacencies from a specific routing instance.
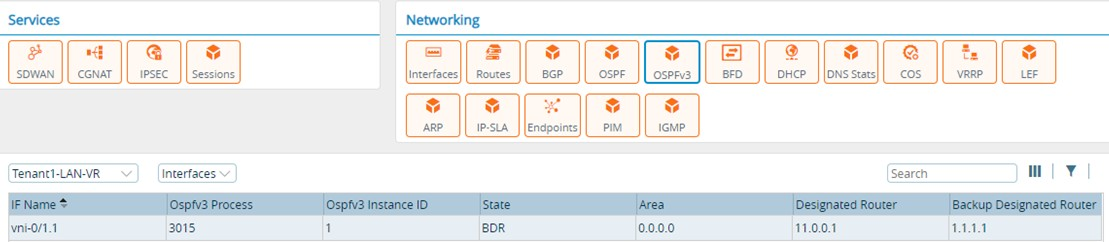
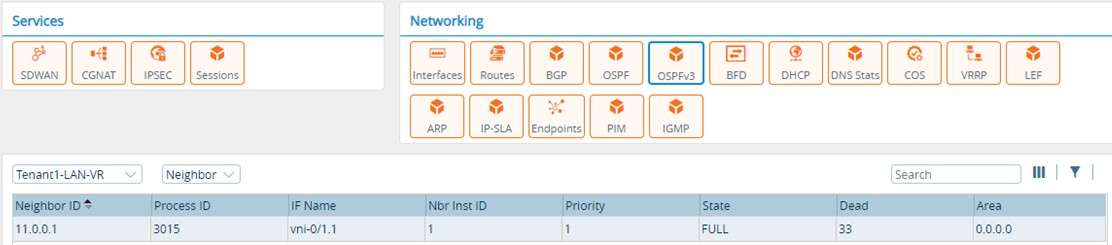
- OSPFv3—show OSPFv3 neighbor adjacencies from a specific routing instance.
Interfaces view
Neighbor view
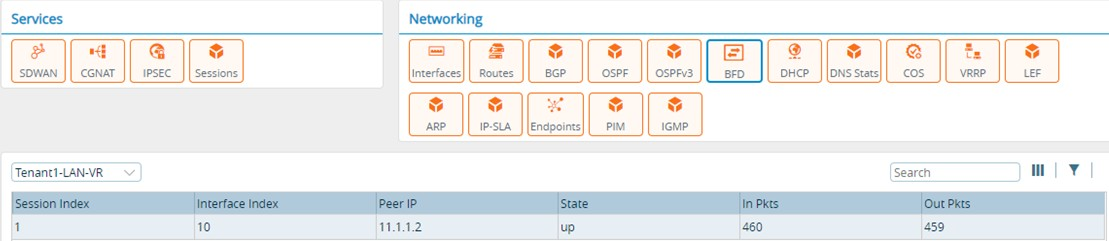
- BFD—show BFD adjacencies from a specific routing instance.
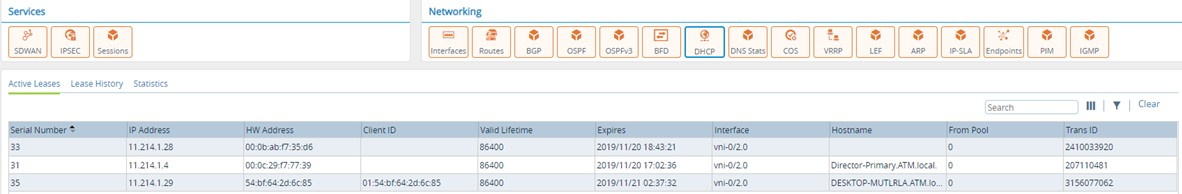
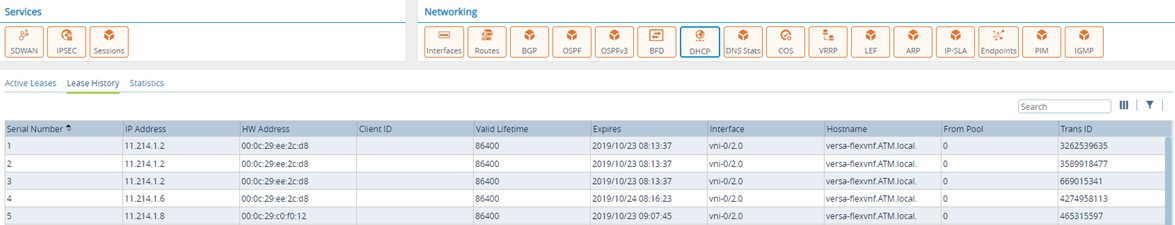
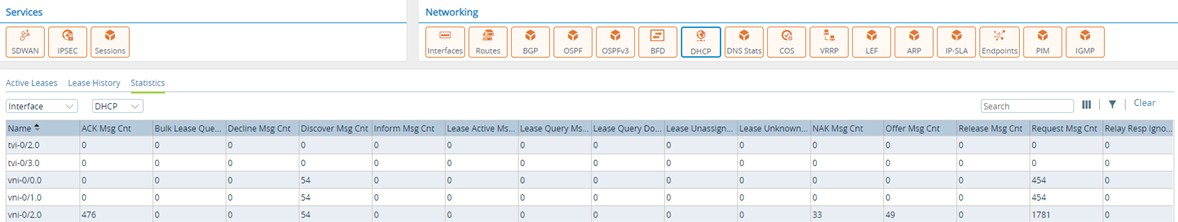
- DHCP—show DHCP active leases, lease history, and statistics.
Active Leases
Lease History
Statistics
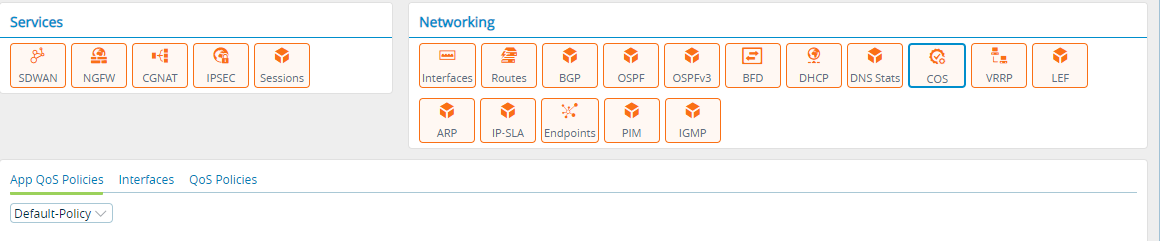
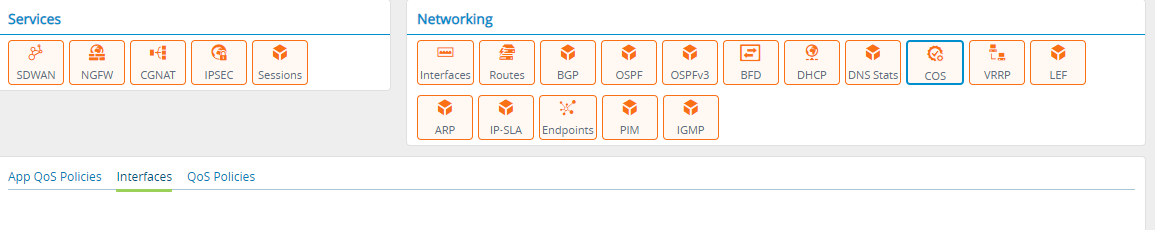
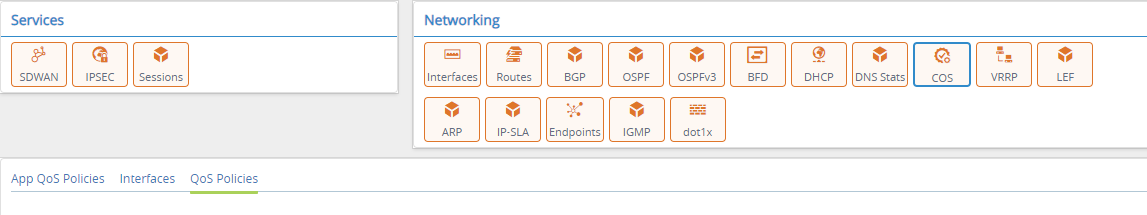
- CoS—shows the following:
App QoS Policies—layer 2–7 QoS policies and their hit count, forward packets/bytes, dropped packets/bytes.
Interfaces—shows the CoS interface details. The details include the transmitted and received packets, number of transmitted packets per second, number of transmitted packets dropped, number of received packets per second, number of received packets dropped, number of transmitted bytes per second, and the number of bytes dropped in transmission.
QoS Policies—layer 2–4 QoS policies and their hit count, forward packets/bytes, dropped packets/bytes.
- VRRP—shows details of VRRP master/slave, configured priority, VIP address.
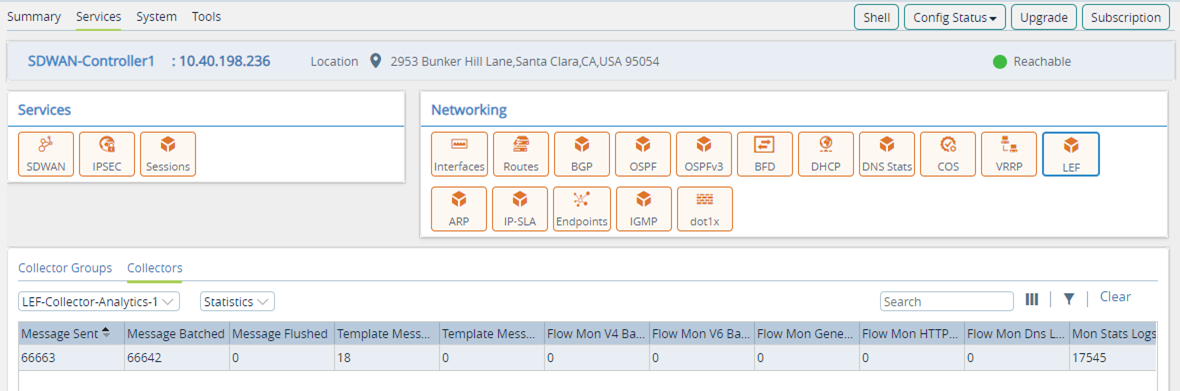
- Log Export Functionality (LEF)—shows the status and statistics of configured LEF devices and groups:
Collector Groups (showing status)
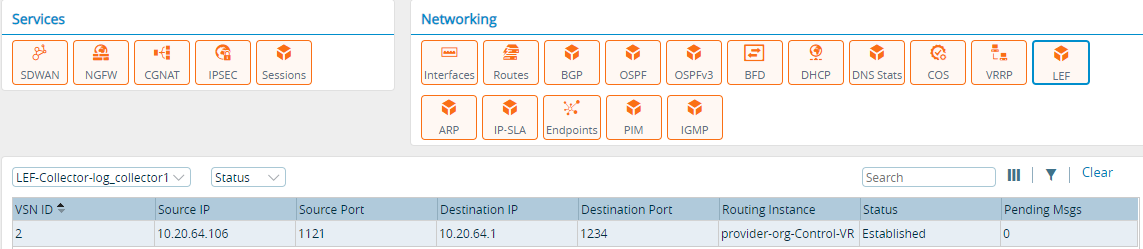
Collectors (showing status)
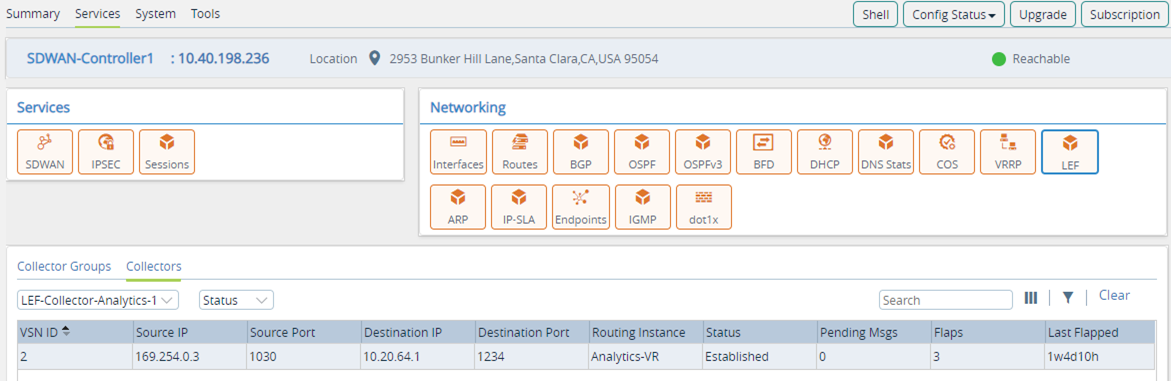
Collectors (showing statistics)
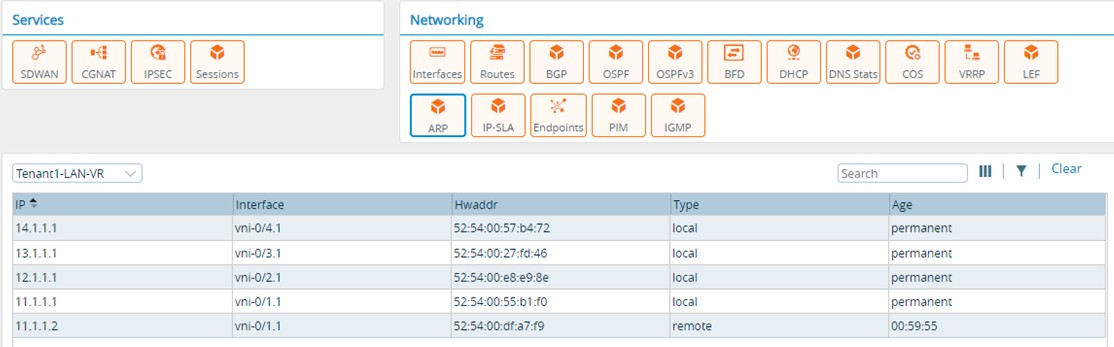
- ARP—shows ARP information for a routing instance.
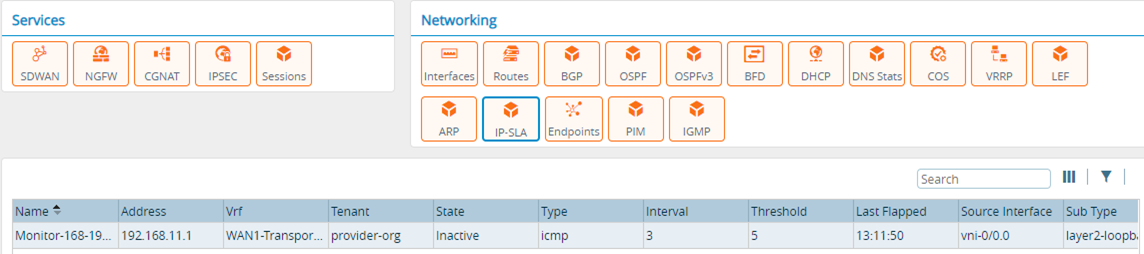
- IP SLA—shows state, address, routing instance, interval and threshold for configured IP SLA.
The system tab displays the following information about the local FlexVNF.
- CPE Resources—shows the CPU, disk, and memory usage for all the CPE resources.
- Firmware Summary—shows the hardware and software details.
- Device Summary—shows the device location and address.
- System Overall Status—shows the status of all the processes running on the system.
- Associate Templates—shows the name of the templates associated with the device.
- NTP Client Statistics—shows the NTP statistics.
- License—shows the license mode and status.
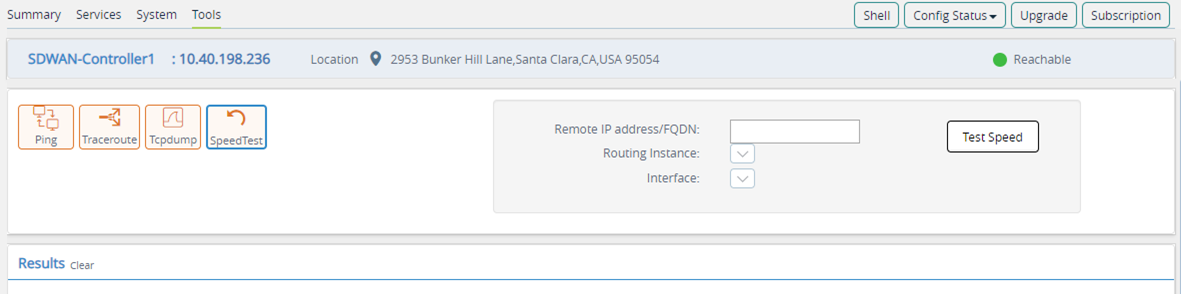
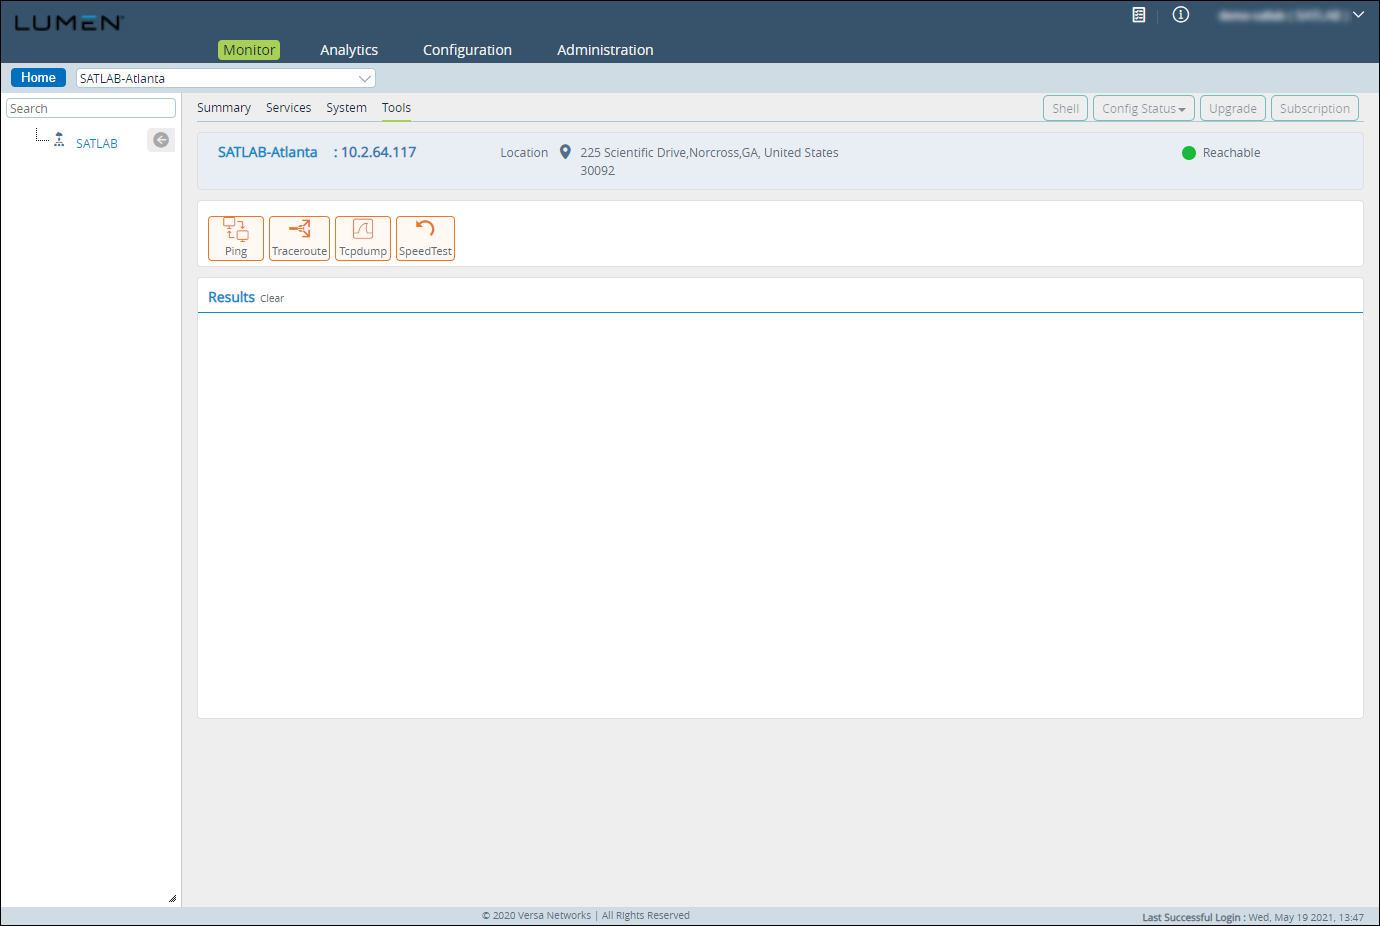
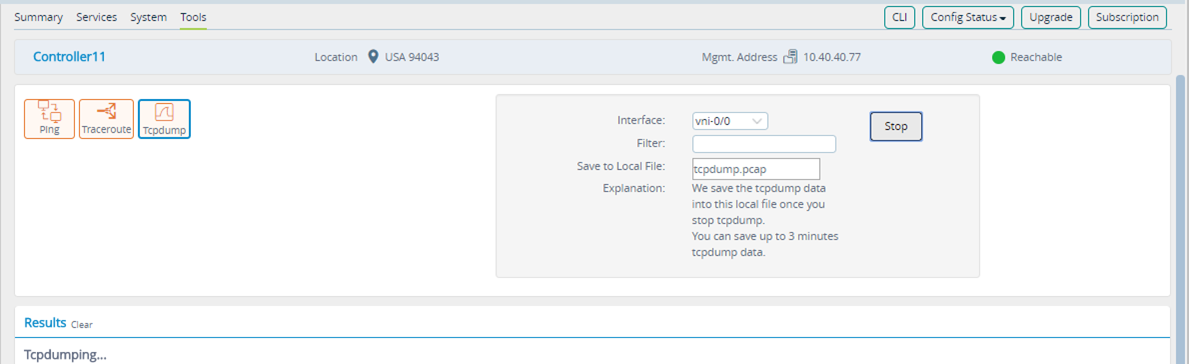
As a part of the troubleshooting process, Versa Networks exposes the following toolsets using the Monitor tab.
- Ping
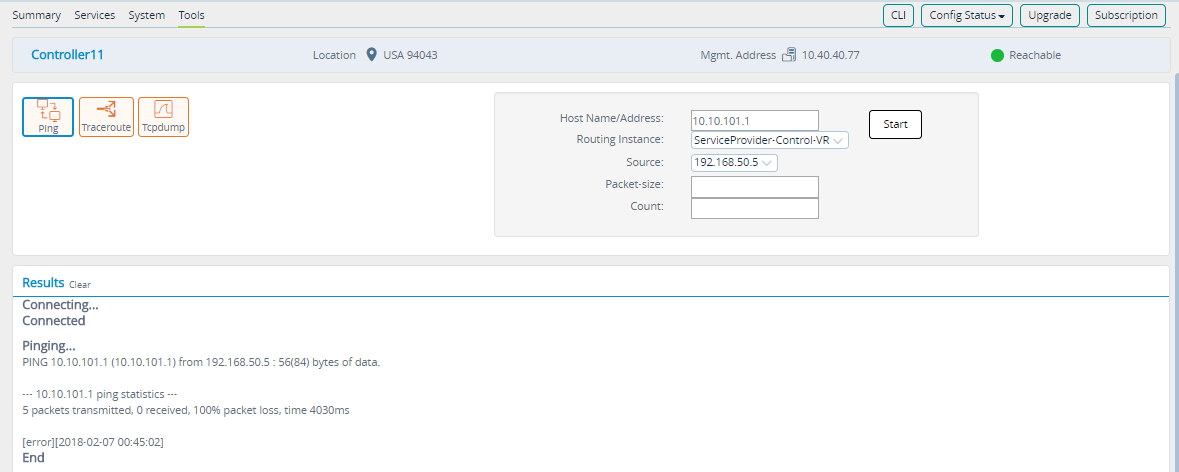
- Traceroute
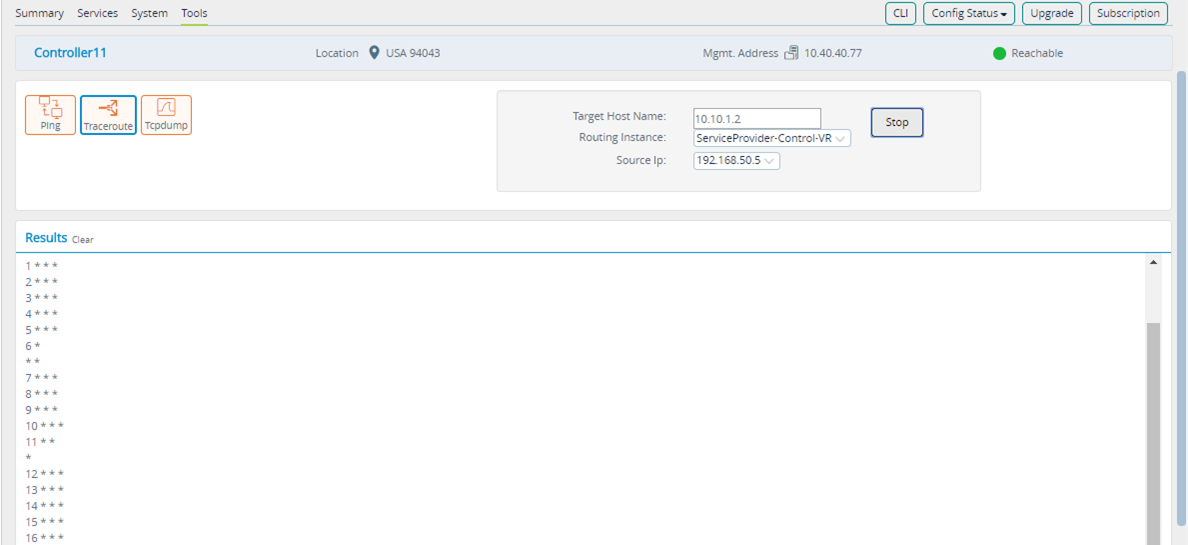
- TCPDump—you run tcpdump from the monitor tab using the standard tcpdump command syntax. When the tcpdump operation complete, a .pcap is downloaded to the local workstation.
- Speed Test—a device can be set up as a speed-test server and from the local FlexVNF you can run a speed test to test the link.