Viewing a busy-hour report for Voice Complete
Using Lumen Connect, you can access call volume for a Lumen® Voice Complete® service by viewing a busy-hour report. Report times are shown in GMT.
Note: The data includes every hour within a 24‑hour period. If traffic typically occurs only during normal business hours, and is absent throughout the night and weekends, your least busy hour will likely be zero.
To view a busy-hour report for Voice Complete:
- Using the left menu, click Monitoring, click Voice Reports, then click Voice Complete.
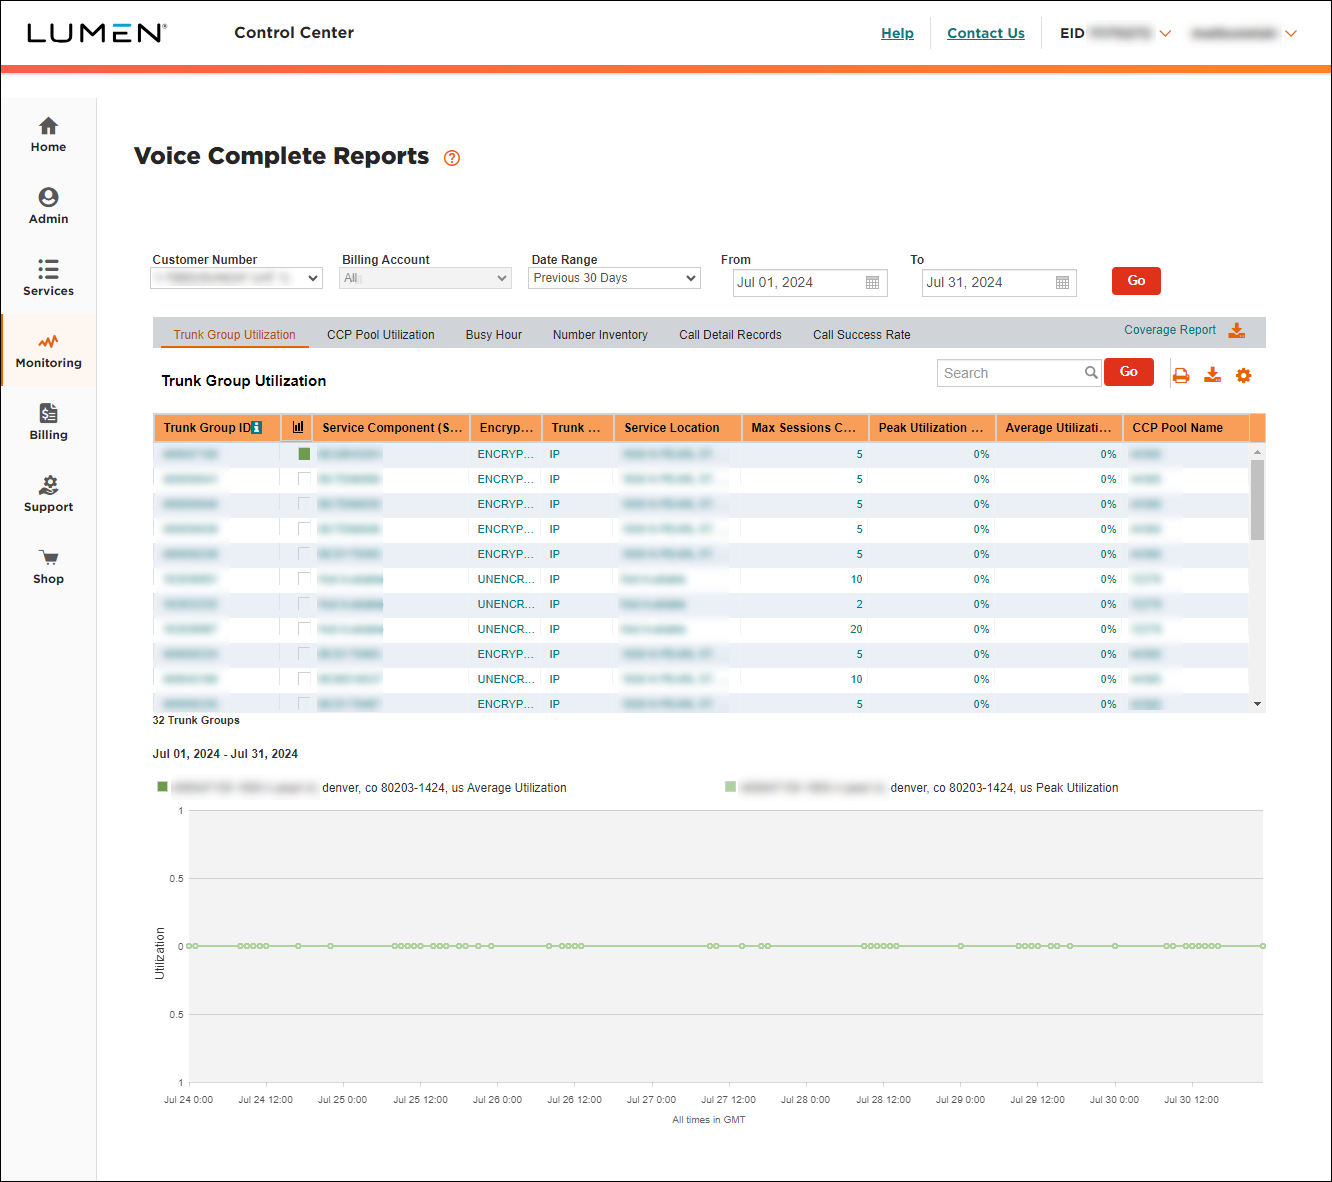
- Select the customer number with the Voice Complete trunk group(s) you want to view busy-hour data for.
- Use the Date Range field to select the time period for the report. (If you select Custom Date Range from the list, use the From and To fields to specify the date range for the report.)
- Click Go.
- Click the Busy Hour tab.
Lumen Connect shows the busy-hour report for the first trunk group on the customer number you selected:
- Trunk Group ID: the identifier of the trunk group.
- Service Component ID (SCID): the individual billable component of service displayed on an invoice.
- Service Location: the service location for each SCID.
- Busiest Hour: the single most busy hour, on average, for the dates within the date range selected (in GMT).
- Least Busy Hour: the single least busy hour, on average, for the dates within the date range selected (in GMT).
- Busy Volume: the number of calls that took place during the busiest hour.
- Least Busy Volume: the number of calls that took place during the least busy hour.
- Highest Utilization %: the percent of time the sessions were in use throughout the busiest hour.
- Trunk Group ID: the identifier of the trunk group.
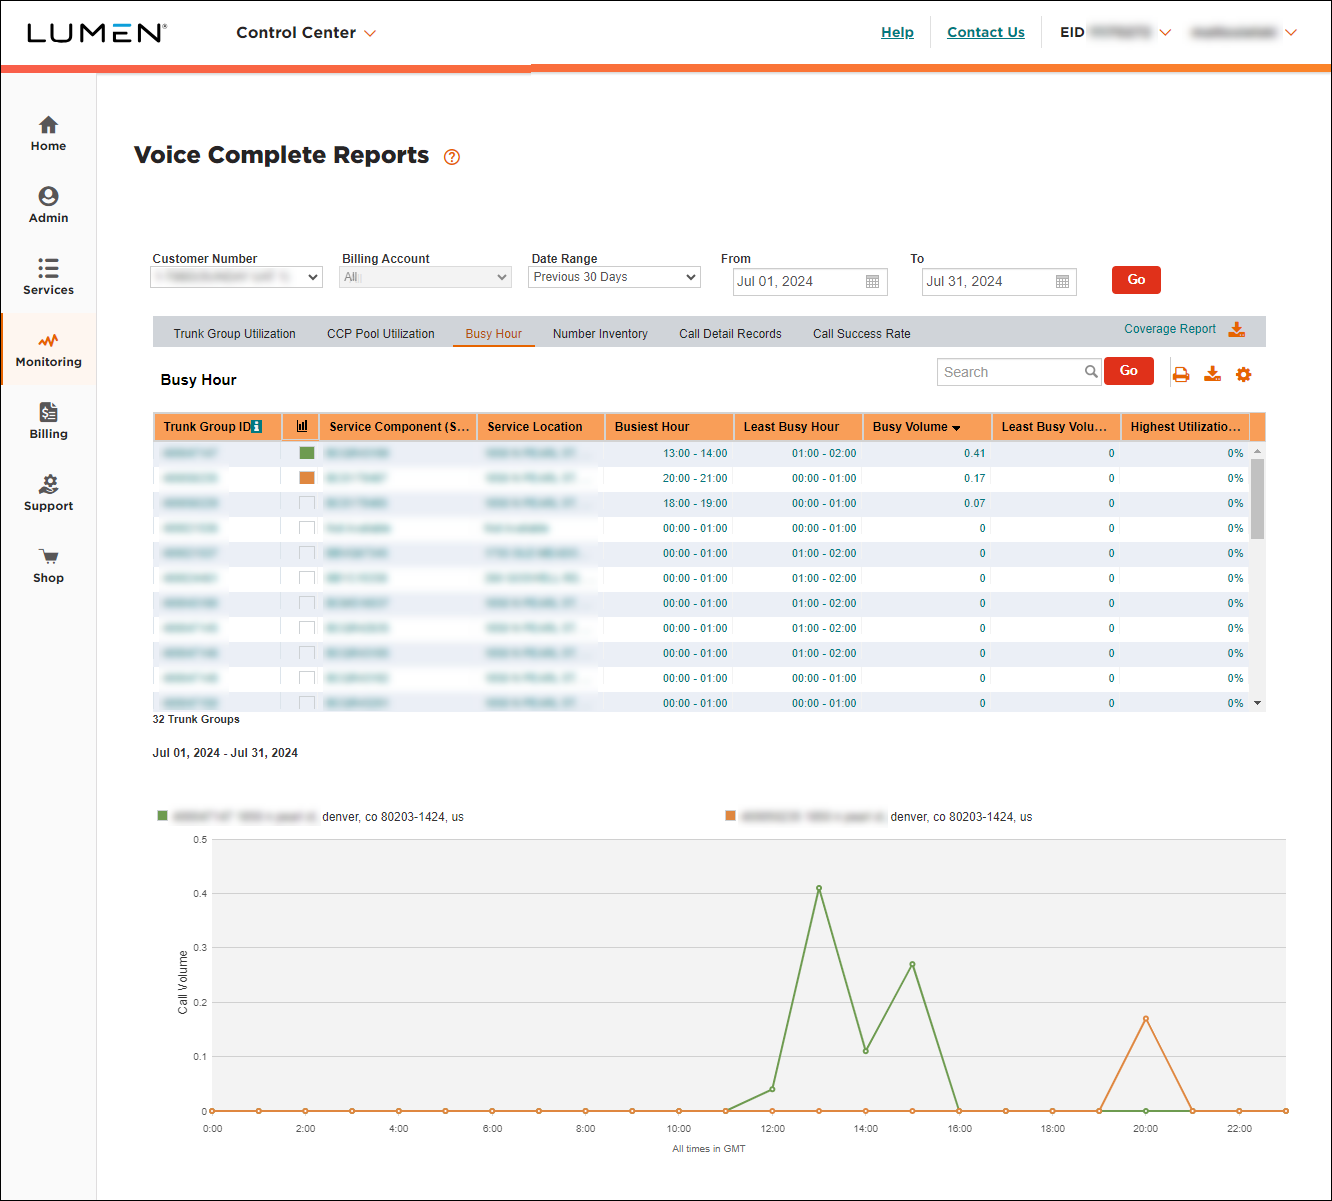
- Select the checkbox (in the column) next to the trunk group(s) you want to view on the graph.
Lumen Connect updates the graph as you select and clear the checkboxes.
- Do any of the following:
- To print the report, click the icon.
- To download the report, click the icon.
- To customize the columns shown on the report, click the icon, select or clear checkboxes to adjust the columns, then click OK. (To reset to the default view, click Reset Columns.)
- To print the report, click the icon.


