Creating a custom summary report in Bill Analyst
If our standard summary billing reports don't provide you with the information you need, then you can create a custom summary report in Bill Analyst. (To view detailed billing reports view a standard detail billing report or create a custom detail billing report.) You can also add a description to a service to add more meaning to your reports.
Having trouble creating a custom summary report? Learn how to fix errors with your report
To create a custom summary report:
- Using the left menu, click Billing, then click Bill Analyst.
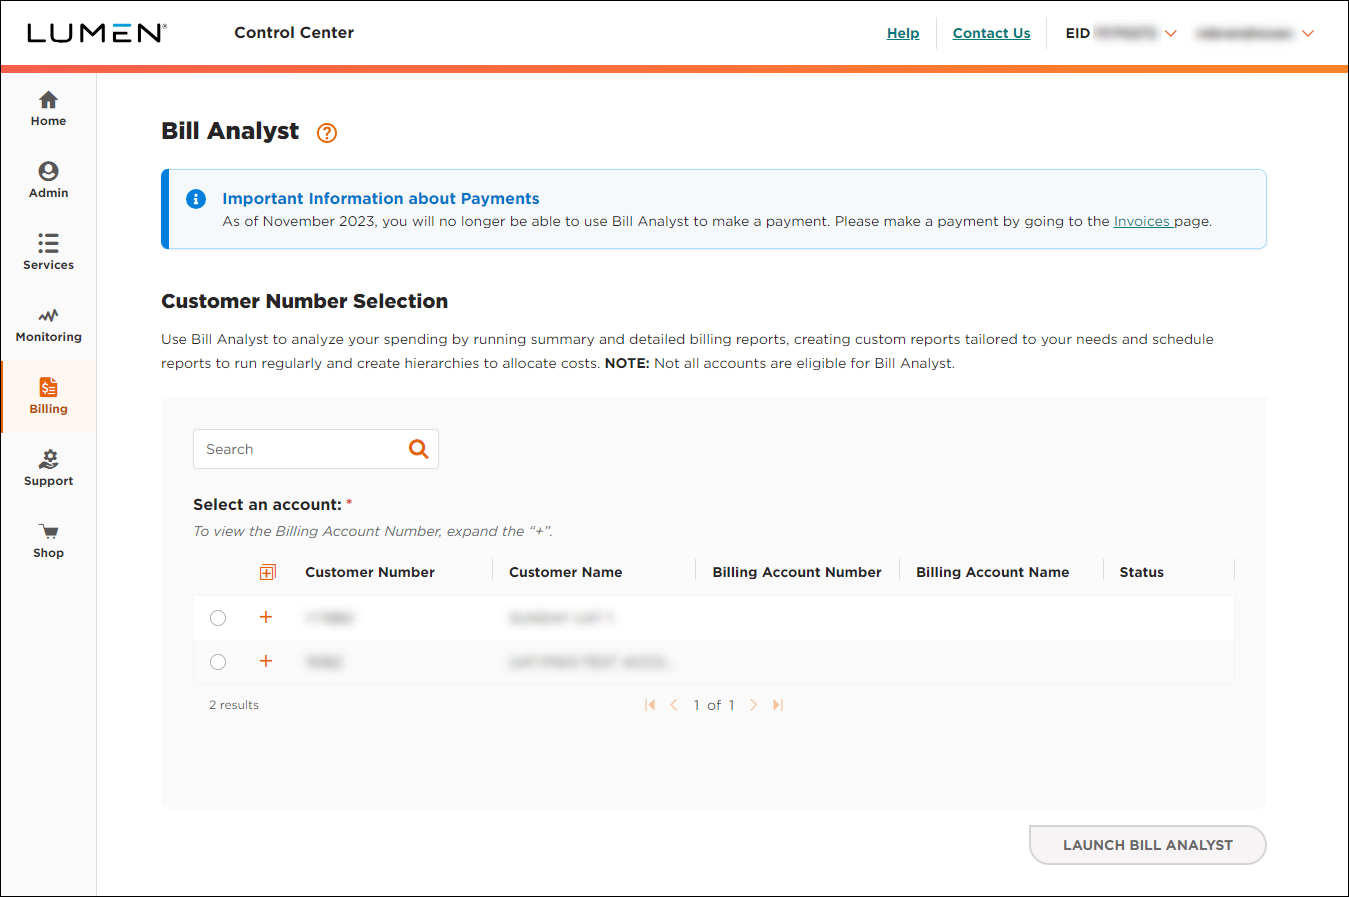
- Select the radio button next to the account you want to view, then click LAUNCH BILL ANALYST.
Control Center opens Bill Analyst on a new tab.
- Click the Reports tab, then click Summary Reports.
Bill Analyst lists the available summary billing reports.
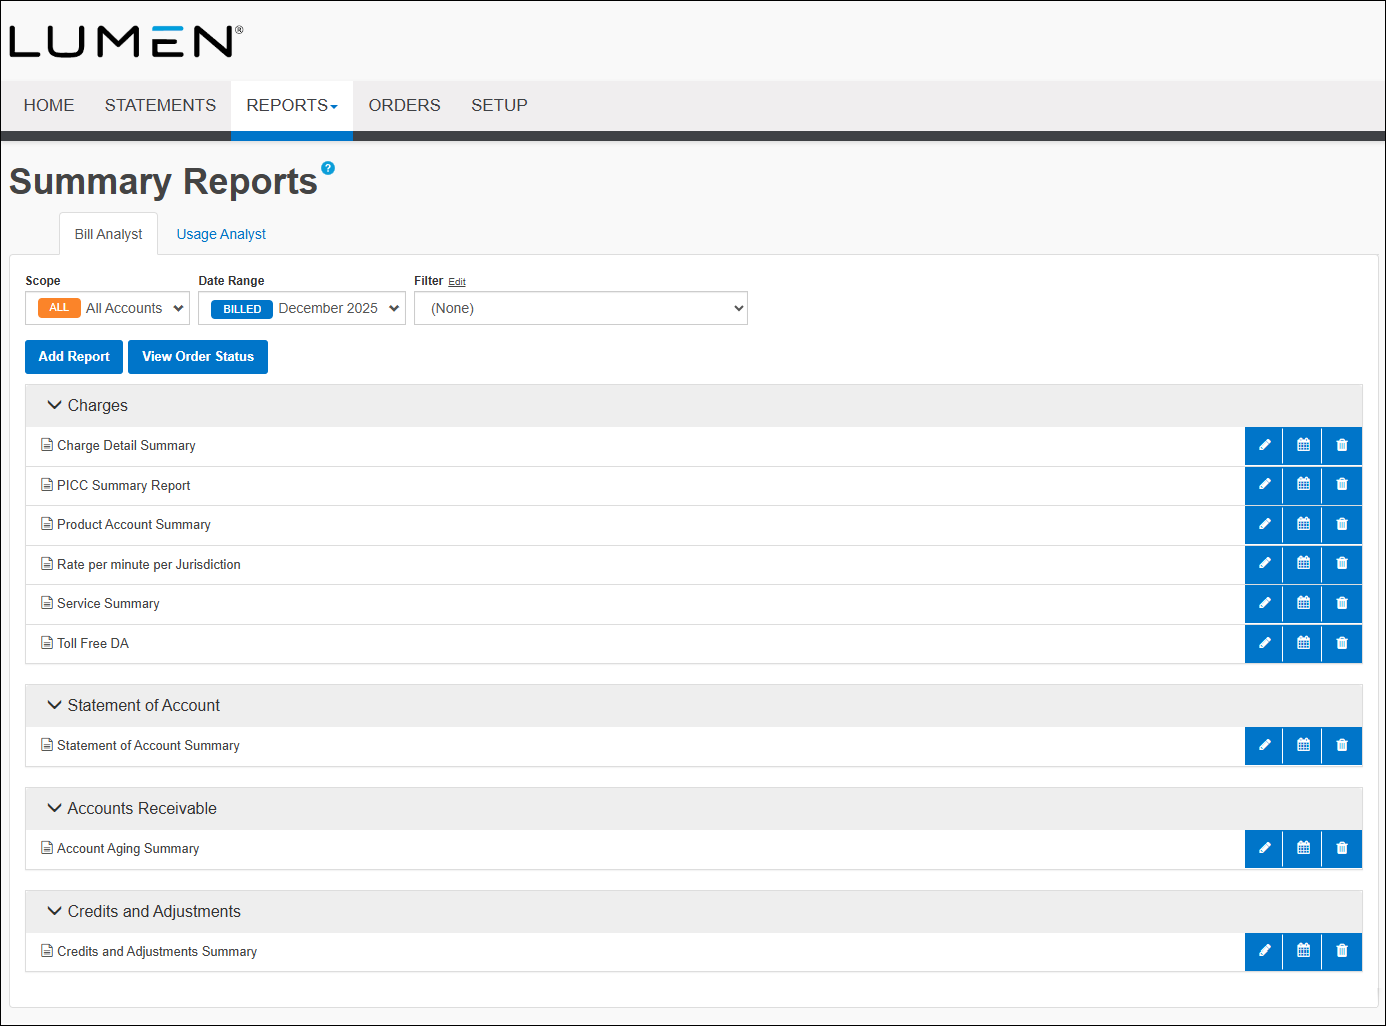
- Click Add.
- Click Add, then do one of the following:
- Select the Start with a copy of an existing report radio button, then from the Report Name field, select the report you want to copy.
- Select the Start a new report radio button, then from the Report Type list, select the type of report you want to create.
- Select the Start with a copy of an existing report radio button, then from the Report Name field, select the report you want to copy.
- Click Continue.
- Type the name of the report, then select a filter from the list (if you want to apply one), then in the Graph View section select the format for the report, either Table or Graph.
- Complete the Grouping section:
- From the Group list, select how you want to organize the data.
- From the Sort By list, select how you want to sort the data in the report.
- From the Minimum Value list, select whether you'd like to exclude data that falls below a certain value and the minimum number you want to appear on the report.
- From the Subgroup list, select the subgroup to apply to the report.
If you want to use a secondary set of data to group the data for the report, complete the subsequent subgroup sections with the same parameters as listed above.
- From the Group list, select how you want to organize the data.
- Complete the Subtotals Display section:
- Select the Subtotal all tiers, Subtotal at the lowest tier, or Don't display subtotals radio button to select the items to subtotal.
- Select either the Show subtotals at top of group or Show subtotals at bottom of group radio button for where you'd like your subtotals placed.
- Select the Subtotal all tiers, Subtotal at the lowest tier, or Don't display subtotals radio button to select the items to subtotal.
- In the Table View section, select the fields you want included in your report by using the > button to move a field from the Exclude list to the Include list. To delete a field, use the < button to move a field from the Include list to the Exclude list.
- In the Graph View section, set the parameters for the report. You defined the type of layout above. If you wish to change the layout format, you can do so here.
- In the Additional Options section, if you want to share the report, select the Share this report checkbox.
- Click Save.
Explore Control Center


